US Dollar Index Up 1.3% This Week: What CPI, PPI and Middle East Tensions Mean for the USDX
Vantage Editorial Team >
Vantage Editorial Team >
Vantage is a global, multi-asset broker with a team of in-house writers and market analysts who produce educational and insightful trading content for traders of all levels.

The US Dollar Index (USDX) is trading at 99.28 as of 18 May 2026 at 01:45 UTC, its strongest level in about a month. That is up nearly 1.5 points from the 97.80 area where it started the week.
The driver is straightforward: two back-to-back inflation shocks. April CPI printed at 3.8% year-on-year on 13 May, the highest since 2023. Then April PPI came in at 6.0% year-on-year on 14 May, the sharpest annual reading since December 2022, with the monthly rate of 1.4% almost three times the 0.5% forecast. Together they have repriced the Federal Reserve’s path in a hurry.[1][2]
Markets are no longer debating cuts. Traders are now fully pricing in one rate hike by March 2027, with more than a 50% chance of a move before the end of 2026.[3] Add a rejected Iran ceasefire proposal and a Trump-Xi summit that ended without agreement, and the backdrop for the dollar this week has been unusually supportive. This piece breaks down what the chart shows and where the key levels sit. All prices are as of 18 May 2026, 01:45 UTC. This is not financial advice.
Key Points
- The USDX hit 99.28 on 18 May 2026, its strongest in about a month, after rallying roughly 1.3% on the week[4], driven by April CPI of 3.8% YoY and PPI of 6.0% YoY, the hottest back-to-back inflation prints since 2022.
- Markets have increasingly priced out any 2026 Fed rate cut and are now pricing a hike, with odds of a move before year-end climbing to around 50%. That shift in rate expectations is the primary force behind this week’s USD move.
- EUR/USD has sold off steadily from 1.1790 to 1.1621 through the week, breaking multiple support levels. USD/JPY has climbed from 157.10 to 159.03 without triggering intervention, with 160.00 the level traders are watching closely.
USDX: What the Chart Is Showing
Looking at the 5-minute chart from 12 to 17 May 2026, the USDX was trading near 97.80 at the start of the week. The index then moved steadily higher through the session, with the most visible acceleration coming after the CPI release on 13 May.
By 17 May, the index was pressing toward 99.20, and as of the early hours of 18 May 2026, it reached 99.311 with a session high of 99.311 and a low of 99.278. Volume picked up noticeably from the 15 May session onward, consistent with a market building into the move rather than chasing a spike.
The rally has now recovered most of the ground lost since the USDX peaked at 99.18 on 8 April 2026.[5] What it has not done is clear the 99.45 to 100.25 resistance band that capped the index in late April. That zone remains the key test for whether the current move extends or stalls.

What Is Driving the USDX: Three Things That Matter This Week
1. Back-to-back inflation shocks flipped rate expectations
April CPI came in at 3.8% year-on-year, above the 3.7% forecast and up sharply from 3.3% in March. Energy prices accounted for 40% of the increase.[1] The monthly rate of 0.6% was in line with estimates but the annual surprise was enough to move markets.
Then on 14 May, PPI landed at 1.4% month-on-month[2], nearly three times the 0.5% forecast. Annual PPI hit 6.0%, the highest reading since December 2022. Services drove nearly 60% of the monthly rise. The DXY climbed 0.24% immediately after the PPI release.[2]
Before these two prints, traders had already priced out rate cuts. After them, a hike is now being actively priced. The shift in the rate path is the single most important driver of the dollar’s week.
2. Middle East conflict headlines and a failed Trump-Xi summit
President Trump described the opening clause of Iran’s latest ceasefire proposal as ‘unacceptable’ this week, keeping the Strait of Hormuz effectively closed and energy prices elevated. Brent crude continued to press higher.[3]
A two-day summit between Trump and Chinese President Xi Jinping ended without any major agreements, including no sign that Beijing would help facilitate progress on the Iran situation. Markets treated both developments as further evidence that energy-driven inflation has no near-term resolution.[3]
For the dollar, the Middle East conflict continues to create a trap: higher energy prices push US inflation up, which removes the rate-cut path, which in turn supports the greenback. The war is not causing dollar strength; it is making it harder for the Fed to end it.
3. Powell out, Warsh in, but no immediate dovish shift
Jerome The Senate confirmed Kevin Warsh as the 17th Federal Reserve chair on 13 May 2026, in a 54-45 vote, the narrowest confirmation in US history. Powell’s term as chair expired on 15 May; he stays on the Board of Governors. Warsh takes over at a moment when inflation is running well above the Fed’s 2% target and rate hike bets are climbing. Morgan Stanley’s chief economic strategist noted after the CPI print that the data ‘reinforces the reality that new Fed leadership will not result in an immediate dovish shift.’[6][10]
Warsh’s first FOMC meeting as chair is scheduled for 16 to 17 June. The June dot plot will be the first formal signal of the new chair’s rate path. Traders watching the US Dollar Index are pricing the June meeting as the next major repricing event.
Key Levels to Watch: EURUSD and USDJPY
The USDX is a basket, but most of the action this week has played out through EURUSD and USDJPY. Here is where those pairs stand.
| Pair | Current (18 May, ~03:56 UTC) | Key Support | Key Resistance | This week’s story |
| USDX | 99.28 | 98.00 / 97.56 | 99.45 / 100.25 | Strongest in a month; +1.3% on the week |
| EUR/USD | ~1.1621 | 1.1600 / 1.1550 | 1.1700 / 1.1741 | Steady sell-off from 1.1790; down ~170 pips on week |
| GBP/USD | ~1.3313 | 1.3300 / 1.3250 | 1.3400 / 1.3480 | Down ~327 pips (2.4%) on week from 1.3640 |
| USD/JPY | ~159.03 | 158.00 / 157.50 | 159.20 / 160.00 | Grinding higher all week; 159.03, approaching 160 intervention zone |
Table 1: Key levels as of 18 May 2026, 01:45 UTC. Sources: InvestingLive, FXStreet, TradingView. Indicative only.

EURUSD: The pair remains confined to a narrow range this week, trading in just a 169-pip weekly band as of Friday. EURUSD has been in a steady downtrend all week, falling from around 1.1790 on 12 May to 1.1621 by 18 May 03:56 UTC. The pair has broken through multiple support levels, with 1.1600 and 1.1550 now the zones traders are watching for the next area of demand. On the upside, 1.1700 and the former support at 1.1741 have flipped to resistance.[7] The EUR’s energy vulnerability relative to the US, combined with the rate hike repricing, has kept upside attempts capped.
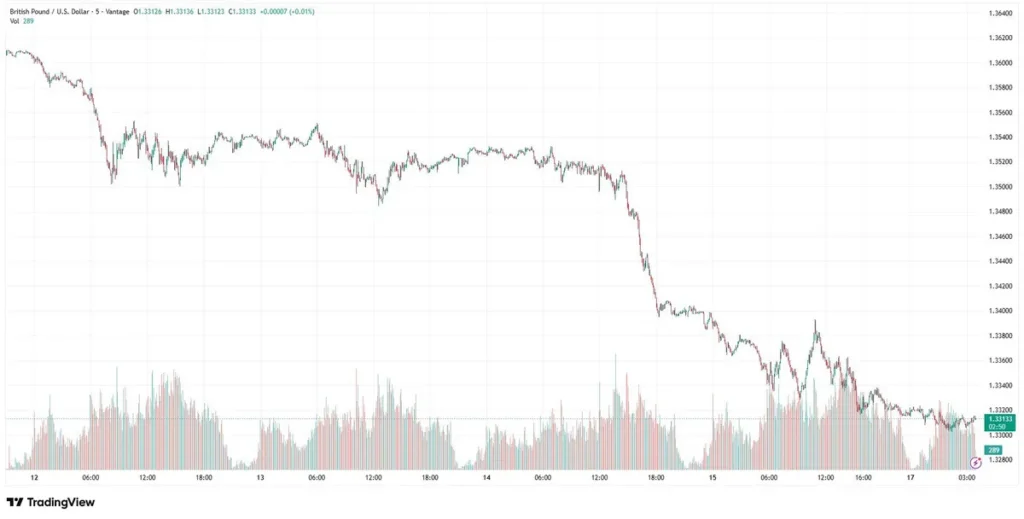
GBPUSD: Sterling had its worst week in months, falling from around 1.3640 on 12 May to 1.3313 by 18 May 03:57 UTC — a drop of roughly 327 pips (2.4%). The sharpest leg down came through the New York session on 14 May, coinciding with the PPI release. The pair is now watching 1.3300 and 1.3250 as immediate support, with 1.3400 and 1.3480 as the resistance levels it would need to reclaim to stabilise.

USDJPY: The pair briefly broke above 160 earlier in May, approaching levels last seen in 2024, before Japanese officials, including Finance Minister Katsunobu Kato, signalled they were closely monitoring FX moves for potential intervention. That warning sent the pair sharply lower, back below the 156.20 to 156.28 area, which now acts as resistance.[8] USDJPY has grinded higher through the week without triggering intervention, moving from around 157.10 on 12 May to 159.03 by 18 May 03:57 UTC. The pair is approaching the 160.00 level that prompted official warnings in previous weeks. The 158.00 area is now the nearest support, with 159.20 and 160.00 acting as the key resistance levels traders are monitoring.
Risk Management Notes for Active USD Traders
A week where the dollar moves 1.3% on data surprises is not a normal week. A few things active traders are factoring in:
- Volatility around data remains elevated: Both CPI and PPI moved the USDX within minutes of release. The FOMC minutes, due around 20 May, and the June 16 to 17 FOMC meeting are the next scheduled catalysts where similar moves are plausible.
- Stop Loss placement: Stop Loss levels around 99.45 to 100.25 USDX resistance and the 97.56 to 98.00 support zone matter more than usual in a volatile, data-reactive environment. An intraday wick through a level is not the same as a sustained close.
- Correlation check: This week, gold (XAUUSD) fell more than 3% as the dollar strengthened[4], and the Nasdaq dropped 1.54%.[9] Traders running correlated positions across USD pairs, gold, and equities should account for combined exposure. In a risk-off, USD-positive move, they can all go the same direction at once.
- Leverage in a fast-moving market: Leverage works in both directions. A 1.3% USDX move this week amplified by leverage on forex positions produced outsized swings on individual pairs. Position sizing relative to account equity warrants a review, especially ahead of the FOMC minutes and the June meeting.
What to watch next week: FOMC minutes (around 20 May) will give the fullest picture yet of how divided the committee is and whether the 8-4 split reflects deeper splits on the rate path. Any Iran ceasefire signal or Strait of Hormuz reopening update is the wild card that could move the dollar more than any scheduled data release.
RISK WARNING: CFDs are complex financial instruments and carry a high risk of losing money rapidly due to leverage. You should ensure you fully understand the risks involved and carefully consider whether you can afford to take the high risk of losing your money before trading.
Disclaimer: The information is provided for educational purposes only and does not take into account your personal objectives, financial circumstances, or needs. It does not constitute investment advice. We encourage you to seek independent advice if necessary. The information has not been prepared in accordance with legal requirements designed to promote the independence of investment research. No representation or warranty is given as to the accuracy or completeness of any information contained within. This material may contain historical or past performance figures and should not be relied on. Furthermore estimates, forward-looking statements, and forecasts cannot be guaranteed. The information on this site and the products and services offered are not intended for distribution to any person in any country or jurisdiction where such distribution or use would be contrary to local law or regulation.
References
[1] “CPI inflation April 2026: Prices rose 3.8% annually — CNBC” https://www.cnbc.com/2026/05/12/cpi-inflation-april-2026-.html Accessed on 18 May 2026.
[2] “Producer Price Indexes — April 2026 — U.S. Bureau of Labor Statistics” https://www.bls.gov/news.release/archives/ppi_05132026.htm Accessed on 18 May 2026.
[3] “PPI inflation report April 2026: rate hike odds rise as geopolitical tensions persist — CNBC” https://www.cnbc.com/2026/05/13/ppi-inflation-report-april-2026-.html Accessed on 18 May 2026.
[4] “US Dollar Index at five-week highs, best weekly performance in two months — FXStreet” https://www.fxstreet.com/currencies/us-dollar-index Accessed on 18 May 2026.
[5] “US Dollar Index (DXY) — Trading Economics” https://tradingeconomics.com/united-states/currency Accessed on 18 May 2026.
[6] “Kevin Warsh wins Senate confirmation as the next Federal Reserve chair — CNBC” https://www.cnbc.com/2026/05/13/kevin-warsh-wins-senate-confirmation-as-the-next-federal-reserve-chair.html Accessed on 18 May 2026.
[7] “EURUSD, GBPUSD and USDJPY technical outlook — InvestingLive” https://investinglive.com/technical-analysis/eurusdgbpusd-are-little-changed-and-looking-for-a-shove-usdjpy-is-sharply-higher-why-20260224/ Accessed on 18 May 2026.
[8] “USDJPY falls sharply on intervention threats — InvestingLive” https://investinglive.com/technical-analysis/the-usdjpy-falls-sharply-on-the-intervention-threatswhat-next-for-the-usdjpy-technically-20260430/ Accessed on 18 May 2026.
[9] “Nasdaq Composite (^IXIC), close 15 May 2026: −1.54% — Yahoo Finance” https://finance.yahoo.com/quote/%5EIXIC/ Accessed on 18 May 2026.
[10] “Hot CPI report likely to put Fed on guard for longer-lasting inflation — Yahoo Finance” https://finance.yahoo.com/economy/article/hot-cpi-report-likely-to-put-fed-on-guard-for-longer-lasting-inflation-meanwhile-rate-hike-odds-are-rising-141806600.html Accessed on 18 May 2026.
