USD Forecast May 2026: The Dollar in No Man’s Land
Vantage Editorial Team >
Vantage Editorial Team >
Vantage is a global, multi-asset broker with a team of in-house writers and market analysts who produce educational and insightful trading content for traders of all levels.

The DXY is sitting near 97.84 as of 11 May 2026. That’s a 10-week low, and it tells a strange story.
The dollar should be stronger. There’s a geopolitical tension in the Middle East, oil prices are up nearly 60% from the start of the year, and the Fed just held rates again. All of that, in any normal playbook, adds up to a firmer greenback. Instead, the geopolitical tension premium that briefly pushed the DXY above 103 in March has almost entirely evaporated.
What’s actually happening: markets have looked past the geopolitical headlines and are pricing something more stubborn, a Fed that can’t cut (inflation too high) and can’t hike (growth too soft), while the rest of the world quietly moves reserves away from US assets. That’s a hard environment for the dollar to go anywhere.
This piece runs through the price action, the key levels, and the events that could change the picture. All prices are as of 11 May 2026 (GMT+8). Charts are indicative and from TradingView. This is not financial advice.
Key Points
- The DXY fell to a 10-week low near 97.84 after giving back the conflict-driven spike to 103+. The range traders are watching: 96.00 support, 99.45–100.25 resistance.
- The 29 April FOMC vote split 8-4 — the most divided the committee has been since 1992. Markets now price zero rate moves for all of 2026.
- April NFP came in at 115,000, well above the 62,000 consensus. Good data, but it hasn’t helped the dollar, which tells you how stuck the current setup is.
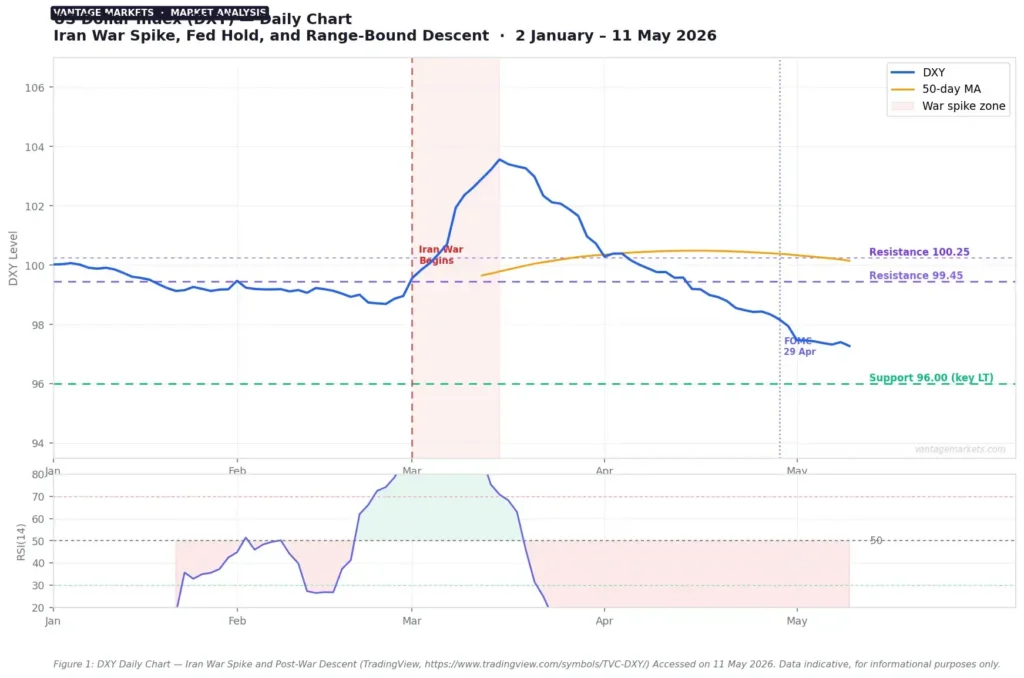
What the chart is showing
The DXY opened 2026 near 100, drifted lower into late February, then spiked hard when the US and Israel launched operations against Iran on 28 February.[1] At its peak in mid-March, the index was above 103.
That was the ‘geopolitical tension premium.’ It lasted about six weeks before sellers took over. By early May, the DXY had given back almost everything. Reuters reported on 6 May that the greenback had ‘gained roughly 3% in the first month of the conflict on short-covering and a partial safe-haven bid, but has lost most of those gains since.’[2]
On the daily chart, the 50-day moving average is declining and the pattern since March is lower highs. The RSI has been sitting in the 40–45 zone, which is not oversold, just uninspired. No clear buying catalyst has emerged to break the pattern.
The three things driving the dollar right now
1. The Iran geopolitical tension — an energy shock that cuts both ways
The Strait of Hormuz closure disrupted around 20% of global oil supply.[3] Brent peaked near $118 in late March before pulling back to roughly $96 by early May, still well above the $61 level at the start of the year.
For the dollar, this is a trap. Higher energy prices push US inflation up (the Dallas Fed estimates headline CPI could be 1.1 percentage points higher if the Strait stays closed for three quarters[4]), which keeps the Fed on hold. But the same shock is slowing US growth and hammering consumer confidence, which hit a record low in late April. The dollar gets neither the rate-cut hope nor the rate-hike catalyst it needs to move cleanly in either direction.
The ceasefire is still technically holding as of 11 May, but Iran hasn’t responded to the US proposal to reopen the Strait. Until that changes, the DXY will keep trading around geopolitical tension headlines.
2. The Fed — the most divided committee in 30 years
The 29 April FOMC meeting held rates at 3.50%–3.75%, but the vote was 8-4, the last time four members dissented was October 1992.[5] One member (Miran) wanted to cut immediately. Three others (Hammack, Kashkari, Logan) voted to hold but opposed any easing language in the statement.
The statement itself flagged ‘elevated uncertainty’ from the Middle East and noted job gains have been ‘low on average.’ Markets took that as a signal to price out any 2026 rate move entirely. CME FedWatch now shows zero cuts for 2026 and one 25bp cut in December 2027.[6]
There’s also a leadership angle. Powell confirmed he’ll stay on the Board of Governors, but Kevin Warsh is expected to become chair. The first FOMC meeting he may chair is 16–17 June and nobody knows yet how that changes the committee’s communication style.
3. The data — solid labour market, but it’s not helping
April NFP came in at 115,000 against a 62,000 consensus.[7] The second consecutive monthly gain, the first such run in nearly a year. The unemployment rate held at 4.3%.
The dollar didn’t rally. That’s actually the most telling part of this market: When good data doesn’t move the currency, it usually means the bigger forces are elsewhere. In this case, solid payrolls don’t change the inflation ceiling or the growth floor that’s keeping the Fed stuck.

Levels to watch
The table below covers the zones traders are monitoring across major USD pairs. These are reference levels, not trade signals.
| Pair | Support | Resistance | What’s happening |
| DXY | 96.00 | 99.50 / 100.60 | Near 97.84 — range-bound, war-headline driven |
| EURUSD | 1.1670 / 1.1480 | 1.1800–1.1849 | ~1.1732–1.1760 — approaching key resistance zone |
| USDJPY | 155.50 | 157.70 / 160.20–160.60 | ~155–157 — intervention watch above 160 |
| XAUUSD | 4,493–4,540 | 4,735 / 4,848 | ~$4,678–$4,715 — up 43% YoY, geopolitical bid |
| USDMYR | 4.2800 | 4.5000 | BNM stabilisation measures in background |
Table 1: Key levels as of 11 May 2026. Sources: FXStreet, Forex.com, TradingView, Reuters. Indicative only.
A few things worth noting on specific pairs:
- EURUSD sold off sharply in early March as Europe’s energy vulnerability hit the euro. It’s recovered most of that, and is now testing the 1.18–1.19 trendline that’s capped the pair since 2018. Forex.com analysis notes a confirmed close above that zone would open levels not seen since 2021.[8]
- USDJPY is more complicated. Safe-haven yen demand pushed the pair lower when the geopolitical tension started, but that partially reversed. Japan may have intervened when the yen slid past 160/$. The Reuters FX strategist poll from 6 May puts the median forecast at 156/$ in three months and 154/$ in six.[2]
- Gold (XAUUSD) has benefited from both a weaker dollar and elevated geopolitical risk. Traders watching USD pairs should keep this correlation in mind — a DXY breakdown toward 96.00 would likely give gold another leg up.

What to watch this week and beyond
The calendar is dense. These are the events most likely to move USD pairs:
- CPI — 13 May: The most important near-term print. A surprise higher cements the ‘no cuts in 2026’ view. A miss would bring rate cut talk back fast and likely push the DXY toward 96.00.
- PPI — 14 May: Back-to-back with CPI. Together they give the most complete inflation picture before the June FOMC.
- April FOMC Minutes — ~20 May: The full record of the 8-4 vote. Traders will be looking at how far apart the doves and hawks actually are behind closed doors.
- FOMC — 16-17 June: The first meeting potentially chaired by Warsh. How the new leadership communicates — or doesn’t — on rate direction is a fresh unknown for dollar positioning.
- Strait of Hormuz: Any credible signal that the waterway is reopening would relieve energy price pressure and potentially open the door to Fed cuts sooner — which would shift the dollar lower. Escalation goes the other way.
On risk management: the DXY has been reacting to geopolitical headlines within minutes. Standard intraday range assumptions are less reliable in this environment. Stop Loss placement around the 96.00 support and 99.45–100.25 resistance matters more than usual. And if you’re holding correlated positions across gold, yen, and short-dollar pairs, check your combined exposure — in a risk-off move, they can all gap in the same direction at once.
Leverage works both ways in this kind of choppy, headline-driven range. Position sizing relative to your account is worth revisiting, especially ahead of CPI on 13 May.
RISK WARNING: CFDs are complex financial instruments and carry a high risk of losing money rapidly due to leverage. You should ensure you fully understand the risks involved and carefully consider whether you can afford to take the high risk of losing your money before trading.
Disclaimer: The information is provided for educational purposes only and doesn’t take into account your personal objectives, financial circumstances, or needs. It does not constitute investment advice. We encourage you to seek independent advice if necessary. The information has not been prepared in accordance with legal requirements designed to promote the independence of investment research. No representation or warranty is given as to the accuracy or completeness of any information contained within. This material may contain historical or past performance figures and should not be relied on. Furthermore estimates, forward-looking statements, and forecasts cannot be guaranteed. The information on this site and the products and services offered are not intended for distribution to any person in any country or jurisdiction where such distribution or use would be contrary to local law or regulation.
References
[1] “US-Israel launch military operations against Iran, 28 February 2026 — Reuters” https://www.reuters.com/world/middle-east/ Accessed on 11 May 2026.
[2] “US dollar to remain stuck in range, dependent on the Strait of Hormuz — Reuters poll via Investing.com” https://www.investing.com/news/economy-news/us-dollar-to-remain-stuck-in-range-dependent-on-the-strait-of-hormuz-reuters-poll-4662949 Accessed on 11 May 2026.
[3] “Economic impact of the 2026 Iran war — Wikipedia” https://en.wikipedia.org/wiki/Economic_impact_of_the_2026_Iran_war Accessed on 11 May 2026.
[4] “Implications of the Iran war for US inflation — Federal Reserve Bank of Dallas” https://www.dallasfed.org/research/economics/2026/0417 Accessed on 11 May 2026.
[5] “Fed interest rate decision April 2026: FOMC split 8-4 — CNBC” https://www.cnbc.com/2026/04/29/fed-interest-rate-decision-april-2026.html Accessed on 11 May 2026.
[6] “Fed’s interest rate decision April 29 2026 — Advisor Perspectives” https://www.advisorperspectives.com/dshort/updates/2026/04/29/feds-interest-rate-decision-april-29-2026 Accessed on 11 May 2026.
[7] “April 2026 jobs and inflation data — Kraken Blog” https://blog.kraken.com/economic-brief/may-6-2026 Accessed on 11 May 2026.
[8] “EURUSD outlook: key levels defining 2026 trends — Forex.com” https://www.forex.com/en-us/news-and-analysis/eurusd-outlook-key-levels-defining-2026-trends/ Accessed on 11 May 2026.
[9] “USD forecast 2026: dollar outlook for the next 6 months — Cambridge Currencies” https://cambridgecurrencies.com/usd-forecast-2026/ Accessed on 11 May 2026.
