S&P 500 Uptrend Intact Near 7,360 as Nikkei 225 Tests 62,900 and GER40 Recovers From 25,100 Reversal
Vantage Editorial Team >
Vantage Editorial Team >
Vantage is a global, multi-asset broker with a team of in-house writers and market analysts who produce educational and insightful trading content for traders of all levels.
Three indices are in focus as of 11 May 2026 (GMT+8): the S&P 500 is trading near 7,417 on the 30-minute chart, maintaining the uptrend that has carried it from the March-end lows near 6,343. The Nikkei 225 is around 62,900 in JPY terms, consolidating just below the recent chart highs near 63,500–63,900 after posting the strongest trending advance of the three indices since April. The GER40 is near 24,350, recovering from the sharp reversal off the 6 May spike high near 25,100.
All prices and chart readings below are sourced from 30-minute TradingView charts and reflect levels as of 11 May 2026 (GMT+8). The charts were captured on 13 May 2026 and cover the full period from mid-April. Prices referenced for 11 May are read from the chart at that date. Charts are indicative and from TradingView. This is not financial advice.
Key Points
- The S&P 500 is near 7,417 as of 11 May 2026, up roughly 7.5% from the March-end low near 6,343, with the 30-minute chart showing a consistent pattern of higher highs and higher lows throughout the advance, and the 7,400–7,460 zone representing the next area of overhead interest.
- The Nikkei 225 (Japan Index CFD, JPY) is around 62,900 as of 11 May 2026, having rallied approximately 11% from the early April low near 52,250, with the advance accelerating sharply from late April, the strongest trending move of the three indices on the 30-minute chart.
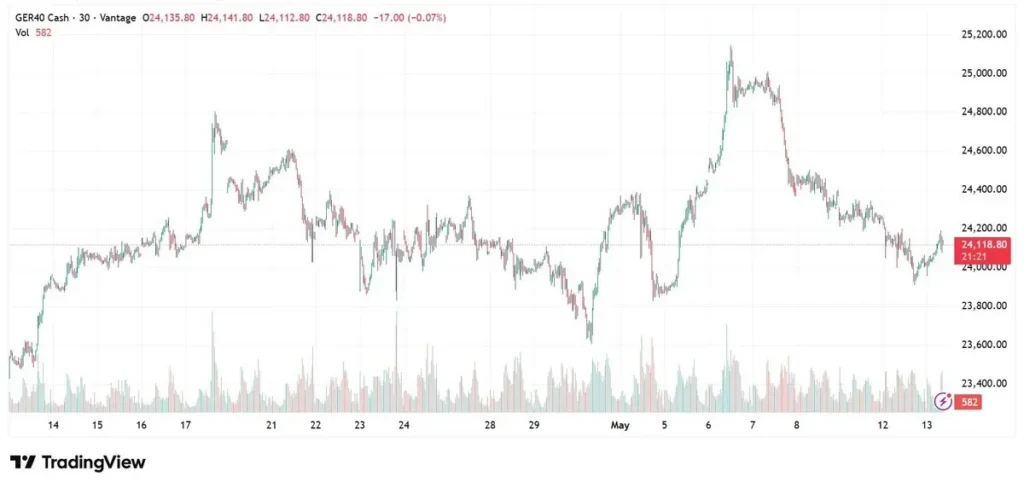
- The GER40 is near 24,350 as of 11 May 2026, recovering from the sharp reversal that followed the 6 May spike to approximately 25,100. The index has been the most volatile of the three on the 30-minute chart, with wide intraday swings in both directions throughout the period.
S&P 500 — Uptrend From 6,850 Carries Index Near 7,360 Heading Into CPI Week
The S&P 500 (SPCFD) opened the period shown near 6,850 in mid-April and has been in a consistent uptrend throughout. As of 11 May 2026 (GMT+8), the index is trading near 7,417 on the 30-minute chart, a gain of approximately 7.5% from the April lows in under four weeks.
The structure of the advance is orderly. The 30-minute chart shows a staircase pattern, rally, brief consolidation, rally, with each pullback holding above the prior swing low. The consolidation in the 7,200 area in late April and early May provided a base before the index broke higher. The recent chart high in the 7,410–7,430 zone, reached around 12 May, sits just above the 11 May level, suggesting the index was approaching but had not yet tested that area on the date in question.
The macro backdrop includes the April Non-Farm Payrolls beat (115,000 against a 62,000 consensus)[1], which reduced immediate recession concern. The 29 April FOMC meeting delivered an 8-4 split vote, the most divided the committee has been since October 1992, but markets absorbed the uncertainty and the index continued higher in the sessions that followed.[2] Volume on the 30-minute chart has been consistent throughout the advance, with no obvious climactic spike that would suggest the move was exhausted as of 11 May.
The zone to watch to the upside from the 11 May level is 7,400–7,460, the area that became the chart high in subsequent sessions. On the downside, the 7,200 area represented a consolidation base in late April and early May, and the 7,100 level marked deeper support from earlier in the period.
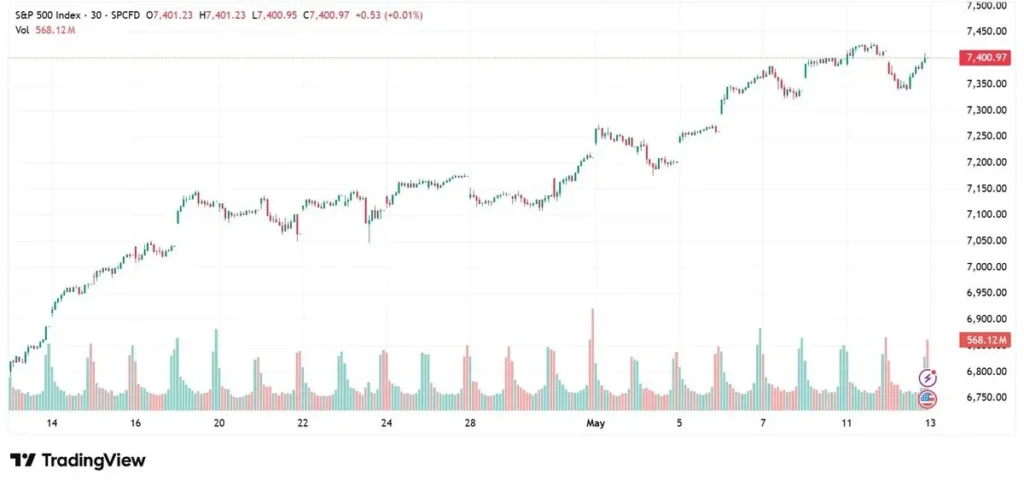
Volume bars throughout the S&P 500 chart are consistent, with upside bars broadly matching or exceeding downside bars during the rally phase. There is no visible divergence between price and volume on the 30-minute chart as of the 11 May price level, which sits within the trending structure rather than at an extended extreme.
Leverage in index CFD positions works in both directions. The S&P 500 has been in a trending environment since mid-April, but intraday pullbacks within the 30-minute structure have been sharp and fast — the 22 April dip and the 28 April consolidation both saw multi-hundred-point intraday swings before the trend resumed.
Nikkei 225 — Strongest Trend of the Three, Around 62,900 on 11 May
The Japan Index Cash CFD (JPY), representing the Nikkei 225, is around 62,900 as of 11 May 2026 (GMT+8) on the 30-minute chart.
The Nikkei 225 chart shows the most clearly trending structure of the three indices. The index moved from approximately 56,500 in early April, dipped briefly near 58,300 around 26–28 April, then accelerated sharply from late April into early May. By 11 May, the index had reached approximately 62,900, a gain of around 11% from the April low and roughly 7.9% from the late-April base. The chart high of approximately 63,900 was reached just after 11 May, in the 12–13 May sessions.
The currency dimension is relevant here: this chart is denominated in JPY. USDJPY movements affect the real-terms return for non-JPY traders. The Bank of Japan’s policy normalisation path and the Ministry of Finance’s intervention history around the 160 level remain background variables.[3] A stronger yen reduces the JPY-denominated gains in foreign currency terms; a weaker yen amplifies them.
Volume on the Nikkei 225 30-minute chart shows a notable spike around 23 April and again in early May, broadly coinciding with the stronger directional moves. By 11 May the index was approaching its chart high with volume remaining constructive rather than declining, consistent with a trend that had not yet shown signs of exhaustion at that price level.

Traders watching the Nikkei 225 alongside carry trade dynamics should note that the index has historically been sensitive to rapid yen moves. Any sharp yen strengthening episode, particularly if USDJPY approaches the 154–155 area, has historically added downside pressure to the Nikkei on a JPY-denominated basis. The 62,900 level on 11 May sat near the upper end of the prior week’s range, with the chart high just ahead.
GER40 — Recovering Near 24,350 After the Sharp 6 May Reversal From 25,100
The GER40 Cash CFD is near 24,350 as of 11 May 2026 (GMT+8) on the 30-minute chart.
Of the three indices, the GER40 has shown the most volatile structure on the 30-minute chart throughout the period shown. The chart opens near 23,500 in mid-April, with a sharp spike on approximately 17 April to near 24,800 followed by an immediate reversal. The index then traded in a wide range between approximately 23,600 and 24,500 through 18–29 April, with multiple sharp moves in both directions.
The defining feature of the GER40 chart is the spike on approximately 6–7 May to near 25,100, a multi-week high, followed by a sharp reversal back toward the 24,000–24,200 area within two sessions. By 11 May, the index had partially recovered to near 24,350, sitting in the middle of the range between the post-spike low near 24,000 and the spike high at 25,100. That 25,100 level represents the clear ceiling on the current chart.
The European Central Bank held rates at its April meeting and flagged that services inflation in the eurozone remains stickier than expected.[4] That communication has kept rate-sensitive sectors like financials, real estate, and utilities in a holding pattern, which may partly explain the GER40’s choppier structure relative to the more directional US and Japanese indices. Eurozone PMI data and German factory orders due later in the week of 11 May were the next scheduled data points of note.[5]
The GER40 is also sensitive to EURUSD movements. EURUSD is testing multi-year resistance near 1.19 — a level that has capped the pair since 2018.[6] Euro strength adds a currency headwind for German exporters and is worth monitoring alongside the GER40 price structure.
Position sizing in the GER40 requires particular attention given the wide intraday swings visible on the 30-minute chart. The 7 May spike-and-reversal from 25,100 is a reminder that sharp moves in either direction can develop and reverse within a short timeframe.
Levels to Watch
The table below covers the key zones visible on the 30-minute charts as of 11 May 2026. These are reference levels drawn from the chart structure, not trade signals.
| Index | Support | Resistance | What’s happening |
| SP500 | 7,100 / 7,200 | 7,400 / 7,460 | Near 7,360 as of 11 May — uptrend from April lows intact, approaching recent highs |
| NI225 | 61,500 / 62,000 | 63,500 / 63,900 | Near 62,900 as of 11 May — strong rally from 56,500 in April, consolidating near highs |
| GER40 | 23,800 / 24,000 | 24,800 / 25,100 | Near 24,350 as of 11 May — recovering from post-7 May spike reversal from 25,100 |
Table 1: Key levels as of 11 May 2026 (GMT+8). Sources: TradingView, Reuters, FXStreet. Indicative only.
What to Watch This Week and Beyond
The calendar is dense. These are the events most likely to move all three indices in the week of 11 May 2026:
- US CPI — 13 May: The most important near-term data point. A higher-than-expected reading would reinforce the ‘no cuts in 2026’ narrative and could weigh on equity valuations, particularly growth-heavy US indices. A miss would bring rate-cut pricing back fast and likely support the current uptrend.
- US PPI — 14 May: Back-to-back with CPI. Together they give the most complete inflation picture before the June FOMC.
- Eurozone PMI — 14–15 May: Key read for the GER40. The manufacturing and services divergence has been a persistent feature of European data this year.
- April FOMC Minutes — ~20 May: The full record of the 8-4 vote. The distance between the doves and hawks behind closed doors will be closely read for clues on the June meeting.
- FOMC — 16–17 June: The first meeting potentially chaired by Kevin Warsh. Any change in communication style is a fresh unknown for index positioning globally.
- Bank of Japan — June: Any signal of further rate normalisation would affect USDJPY and, through the currency channel, the JPY-denominated Nikkei 225.
- Strait of Hormuz: Any material change in the Iran ceasefire status would reprice energy costs and flow through to equity indices with different lag effects across the three markets.
On risk management: all three indices have shown the ability to move sharply on macro headlines within the 30-minute timeframe, the GER40 spike-and-reversal from 25,100 and the S&P 500’s intraday swings through April are both clear on the charts. Stop Loss placement relative to the structural levels in the table above is worth reviewing before the CPI print on 13 May. Traders holding correlated positions across the S&P 500, Nikkei 225, and gold should check combined exposure in a risk-off episode, multiple positions can move against the same account simultaneously.
Leverage works in both directions across all three of these indices. Position sizing relative to account equity is worth revisiting, especially with CPI due on 13 May.
RISK WARNING: CFDs are complex financial instruments and carry a high risk of losing money rapidly due to leverage. You should ensure you fully understand the risks involved and carefully consider whether you can afford to take the high risk of losing your money before trading.
Disclaimer: The information is provided for educational purposes only and doesn’t take into account your personal objectives, financial circumstances, or needs. It does not constitute investment advice. We encourage you to seek independent advice if necessary. The information has not been prepared in accordance with legal requirements designed to promote the independence of investment research. No representation or warranty is given as to the accuracy or completeness of any information contained within. This material may contain historical or past performance figures and should not be relied on. Furthermore estimates, forward-looking statements, and forecasts cannot be guaranteed. The information on this site and the products and services offered are not intended for distribution to any person in any country or jurisdiction where such distribution or use would be contrary to local law or regulation.
References
[1] “April 2026 jobs and inflation data — Kraken Blog” https://blog.kraken.com/economic-brief/may-6-2026 Accessed on 11 May 2026.
[2] “Fed interest rate decision April 2026: FOMC split 8-4 — CNBC” https://www.cnbc.com/2026/04/29/fed-interest-rate-decision-april-2026.html Accessed on 11 May 2026.
[3] “Japan yen and Ministry of Finance intervention watch — Reuters” https://www.reuters.com/markets/currencies/ Accessed on 11 May 2026.
[4] “ECB holds rates, flags sticky services inflation — ECB press conference April 2026” https://www.ecb.europa.eu/press/pressconf/2026/html/ Accessed on 11 May 2026.
[5] “Eurozone PMI and German factory orders schedule — Reuters” https://www.reuters.com/markets/europe/ Accessed on 11 May 2026.
[6] “EURUSD outlook: key levels defining 2026 trends — Forex.com” https://www.forex.com/en-us/news-and-analysis/eurusd-outlook-key-levels-defining-2026-trends/ Accessed on 11 May 2026.
[7] “US dollar to remain stuck in range, Strait of Hormuz dependent — Reuters poll via Investing.com” https://www.investing.com/news/economy-news/us-dollar-to-remain-stuck-in-range-dependent-on-the-strait-of-hormuz-reuters-poll-4662949 Accessed on 11 May 2026.
[8] “S&P 500 market analysis May 2026 — Reuters” https://www.reuters.com/markets/ Accessed on 11 May 2026.
[9] “Bank of Japan June meeting preview: rate normalisation in focus — Nikkei Asia” https://asia.nikkei.com/ Accessed on 11 May 2026.
[10] “GER40 technical overview — FXStreet” https://www.fxstreet.com/ Accessed on 11 May 2026.
