[DAILY TRADING] Oil Prices Today 25 June 2026 – Brent Below $73, WTI Below $70 on 25 June 2026
Vantage Editorial Team >
Vantage Editorial Team >
Vantage is a global, multi-asset broker with a team of in-house writers and market analysts who produce educational and insightful trading content for traders of all levels.
![[DAILY TRADING] Oil Prices Today 25 June 2026 – Brent Below $73, WTI Below $70 on 25 June 2026](https://www.vantagemarkets.io/wp-content/uploads/2026/06/UKOUSD_USOUSD_banner_900x430_optimized-1.webp)
Brent crude oil prices (Vantage UKOUSD CFD) slid to $72.397 and WTI crude oil prices (Vantage USOUSD CFD) to $69.767 as of 02:08 UTC on 25 June 2026 (10:08 GMT+8). Both benchmarks are on a four-session losing streak and are now trading at or below pre-conflict levels, having shed roughly 40% from their wartime peak, according to Trading Economics.[1]
Three converging forces are behind today’s oil market drivers: tanker traffic through the Strait of Hormuz is recovering, markets remain optimistic that the proposed 60-day agreement will reduce supply disruption risks, and OPEC+ is still ramping up output. This analysis reviews today’s oil price charts and highlights the key technical levels. It is not financial advice.
Key Points
- Brent oil prices (UKOUSD) fell to $72.397 and WTI (USOUSD) to $69.767 by 02:08 UTC on 25 June 2026, both under their declining 50- and 200-period moving averages on the 15-minute chart.
- The RSI on the TradingView setup used for this analysis reads 25.99 for Brent and 28.80 for WTI, both near oversold territory, with no reversal signal yet visible on the oil price chart.
- Brent’s prompt spread shifted into contango on 24 June, suggesting that immediate supply concerns have eased and near-term crude availability has improved.
Oil price chart: what Brent and WTI are showing
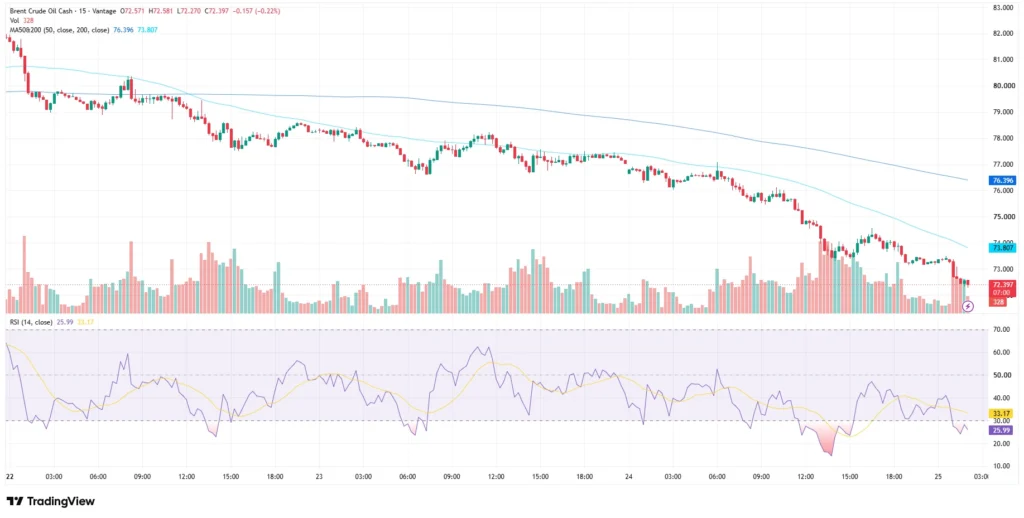
Brent crude oil price chart (UKOUSD, 15-min)
The Brent crude oil price chart shows a clear descending structure from around $81 on 22 June to $72.397 at the time of writing. The 200-period MA ($73.807) and the 50-period MA ($76.396) are both declining and well above price throughout the 22-25 June window. Volume has been elevated on bearish candles. The RSI on the TradingView setup used for this analysis is at 25.99, with its moving-average overlay at 33.17, the RSI line remains below the overlay and near oversold levels with no material bounce.[2]
WTI crude oil price chart (USOUSD, 15-min)
WTI opened the 22 June session above $78 and has since followed a near-identical pattern to Brent, lower highs, declining MAs (200-MA at $70.621; 50-MA at $72.880), and price trading beneath both. The RSI on the TradingView setup used for this analysis is at 28.80 with overlay at 38.87. The RSI briefly touched below 20 during a sharp intraday drop on 24 June before recovering, without a sustained price bounce following it.[2]

What is moving oil prices today
Tanker traffic through the Strait of Hormuz has increased. Shipping conditions improved after international coordination and security assurances encouraged more tankers to resume transits through the waterway.[3] According to IEA estimates, Gulf exports have recovered substantially, with UAE exports approaching pre-conflict levels. The US and Iran are reported to be close to a 60-day memorandum of understanding on a ceasefire extension, pending final sign-off.
On the supply side, seven core OPEC+ members raised output by 206,000 barrels per day (b/d) in both April and May, added 188,000 b/d in June, and a further 188,000 b/d increase is scheduled for July.[4] Saudi Arabia and Kuwait have also cut their Official Selling Price premiums to Asia for July, with Kuwait reducing its premium from $12.75 to $5.25 per barrel over the Oman/Dubai average.
US crude inventories, particularly at the Cushing storage hub, remain historically tight, although recovering Middle East supply has outweighed the bullish impact of those stock draws.[5] A temporary US waiver permitting purchases of already-loaded Iranian crude is expected to add further available supply in the near term.
Key levels to watch
The table below covers the zones traders are monitoring on both instruments as of 02:08 UTC on 25 June 2026. These are reference levels, not trade signals.
| Instrument | Support | Resistance / MA | Chart note |
| Brent (UKOUSD) | $71.00 / $70.00 | $73.81 (200-MA) / $76.40 (50-MA) | RSI 25.99 — near oversold |
| WTI (USOUSD) | $68.00 / $67.00 | $70.62 (200-MA) / $72.88 (50-MA) | RSI 28.80 — near oversold |
Table 1: Key levels as of 02:08 UTC, 25 June 2026. Sources: TradingView (Vantage UKOUSD/USOUSD CFD charts), Trading Economics. Indicative only.
What to watch
- US-Iran ceasefire MOU, ongoing: Final sign-off on the 60-day agreement is the most immediate geopolitical price driver. Any credible breakdown would likely reassert a risk premium in crude oil prices quickly.
- Strait of Hormuz traffic normalisation, ongoing: The pace of tanker transit recovery determines how quickly the remaining supply-disruption narrative clears from the commodity market.
- EIA Weekly Petroleum Status Report, next release 2 July 2026: The next hard data read on US inventory depth and Cushing levels — relevant to the demand-side of today’s oil news.
Risk management
Both UKOUSD and USOUSD are trading at multi-week lows with RSI readings near oversold on the TradingView setup used for this analysis. Oversold readings reflect the speed of the recent move, not an imminent change of direction. Stop Loss placement relative to recent session highs and the declining moving averages is worth reviewing given the pace of the sell-off.
Leverage on CFD instruments amplifies both potential returns and potential losses equally. Position sizing relative to account equity is worth revisiting ahead of any high-volatility session. CFDs carry a high risk of loss due to leverage.

RISK WARNING: CFDs are complex financial instruments and carry a high risk of losing money rapidly due to leverage. You should ensure you fully understand the risks involved and carefully consider whether you can afford to take the high risk of losing your money before trading.
Disclaimer: The information is provided for educational purposes only and does not take into account your personal objectives, financial circumstances, or needs. It does not constitute investment advice. We encourage you to seek independent advice if necessary. The information has not been prepared in accordance with legal requirements designed to promote the independence of investment research. No representation or warranty is given as to the accuracy or completeness of any information contained within. This material may contain historical or past performance figures and should not be relied on. Furthermore, estimates, forward-looking statements, and forecasts cannot be guaranteed. The information on this site and the products and services offered are not intended for distribution to any person in any country or jurisdiction where such distribution or use would be contrary to local law or regulation.
References
[1] “Crude Oil Price – Trading Economics” https://tradingeconomics.com/commodity/crude-oil Accessed on 25 June 2026.
[2] “UKOUSD and USOUSD CFD Charts – TradingView via Vantage” https://www.tradingview.com Accessed on 25 June 2026.
[3] “US crude briefly dips below $70 as tankers transit Strait of Hormuz – CNBC” https://www.cnbc.com/2026/06/24/oil-prices-wti-brent-crude-trump-doj-gasoline-prices-strait-of-hormuz.html Accessed on 25 June 2026.
[4] “Brent Crude Price Outlook: Key Levels After $80 Break – TradingKey” https://www.tradingkey.com/analysis/commodities/oil/261984012-wti-us-brent-oil-tradingkey Accessed on 25 June 2026.
[5] “Short-Term Energy Outlook June 2026 – U.S. Energy Information Administration” https://www.eia.gov/outlooks/steo/ Accessed on 25 June 2026.
[6] “Brent Crude Oil Price – Trading Economics” https://tradingeconomics.com/commodity/brent-crude-oil Accessed on 25 June 2026.
[7] “OPEC Monthly Oil Market Report June 2026 – OPEC” https://publications.opec.org/momr Accessed on 25 June 2026.
[8] “Oil drops on optimism over US-Iran ceasefire talks – CNBC” https://www.cnbc.com/2026/05/29/oil-prices-iran-ceasefire-us-trump-strait-hormuz-energy-costs.html Accessed on 25 June 2026.
