Ceasefire optimism lifts stocks, hits crude and USD
Jamie Dutta >
Jamie Dutta >
Jamie Dutta is a Market Analyst for Vantage. He comes with extensive experience as a full-time trader and financial market commentator, having worked as a trader in top tier investment banks and trading houses.

* Pakistan requests 2-week extension, Trump agreeable if something tangible
* Ceasefire hopes boost risk sentiment, stocks go green late on
* Crude and USD slip into US close on hopes of prolonged deadline
* Gold eventually higher as Treasury yields slide
FX: USD was mixed with competing headlines during the day, ahead of the POTUS 20:00 ET ceasefire deadline deal. As we said last week, the fog of war and media battle continued with both sides’ increasingly bellicose gesturing proving it tough to follow and trade unless you are very nimble. It seemed like it’s less ‘headline havoc’ and more ‘headline fatigue’. The Pakistan headlines saw the buck sell off into the stock finish. US data has been solid in recent weeks, notably Friday’s NFP so the market will be inclined to price in Fed rate hikes if energy prices take another leg higher. There’s nothing really expected by money markets currently in 2026. Eyes are on inflation figures later in the week.
EUR outperformed for most of the day as prices eventually got above the January swing low at 1.1576. Sentiment is the dominant broad market driver. The market had softened up its pricing of an April 25bps ECB hike, which is just under a coin toss chance now, with 75bps of tightening still priced in for this year.
GBP was mid pack among its peers as cable hovered above the recent cycle low posted last Tuesday at 1.3159. A minor fib level of the November to January move resides at 1.3193 and below here is November low at 1.3010. This week has little BoE risk and comes after Governor Bailey tried to push back against recent rate hike bets.
JPY consolidated just below recent highs around 160 and intervention territory. Treasury yields were very quiet for most of the day before turning lower. Today sees the release of the high-profile labour cash earnings data. The figures offer an important measure of wage growth, with the series deemed to be a critical input for the BoJ as they assess the potential for broader wage-driven inflation.
US stocks: The S&P 500 added 0.08% to close at 6,617, the Nasdaq was 0.04% higher at 24,202 and the Dow Jones settled lower by 0.18% at 46,584. Communication Services and Energy were the clear leaders, with Consumer Staples the biggest loser. Broadcom jumped 6.2% after chip deals were announced with Anthropic and Google worth hundred of billions. Alphabet closed 2.1% higher. Intel rose 4.1% as it joined Elon Musk’s Terafab AI chip project to power humanoid and data centre goals. Health insurers like UnitedHealth and Humana shares climbed sharply again as the White House boosted subsidies for certain Medicare payments. Apple fell over 5% at one point before settling 2.1% lower. Earlier reporting had said that the first foldable iPhone is facing setbacks in the engineering test phase that could delay mass production and shipments.
Asian stocks: Futures are mixed. APAC stocks were cautious after the positive Wall Street close but the Trump deadline ahead. Relative resilience of partly reflected positive earnings results from Samsung with a record-breaking profit due to strong demand for AI memory chips. The ASX 200 rallied with miners and tech leading the gains while only staples and industrials lagged. The Nikkei 225 faced headwinds from higher oil and disappointing data. The Hang Seng was closed and Shanghai Composite was cautious after the long weekend.
Gold printed a narrow inside day for most of the day before prices moved above the 100-day SMA at $4645. Any reversal of recent gains may see support around the October highs at $4,380 and then the March low around $4100. Central banks stepped up gold purchases in February, rebounding after a lull in January, according to monthly data from the World Gold Council.
Day Ahead – Post Trump deadline day
As we awaited 20:00 ET and a possible extension, investors continue to assume the extreme risk related to oil supply disruptions will be short-lived. As we said in our monthly review, we are all (pretending to be) oil traders. Key is the spread between the most active front crude futures contract and the third futures contract for Brent crude oil. This shows how quickly investors continue to expect the price to retrace back lower again. For reference, during the early part of the Russian invasion of Ukraine this spread was negative showing higher prices over the months ahead versus the most active contract.
Ultimately, optimism is reflected in the futures oil curve of a sharp retracement in price, though that could be tested again if the ceasefire doesn’t happen and there is an escalation that includes attacks on energy assets. This so-called ‘backwardation’ in the market (curve) may also reflect the indication of a gradual re-opening of the Strait of Hormuz, with Iran appearing to have an increasing number of bilateral agreements with some countries, chiefly in Asia. The 10-point plan was delivered by Iran via Pakistan and Trump stated in recent days that it was a “significant proposal” but “not good enough”. This now appears to be the path to an off-ramp.
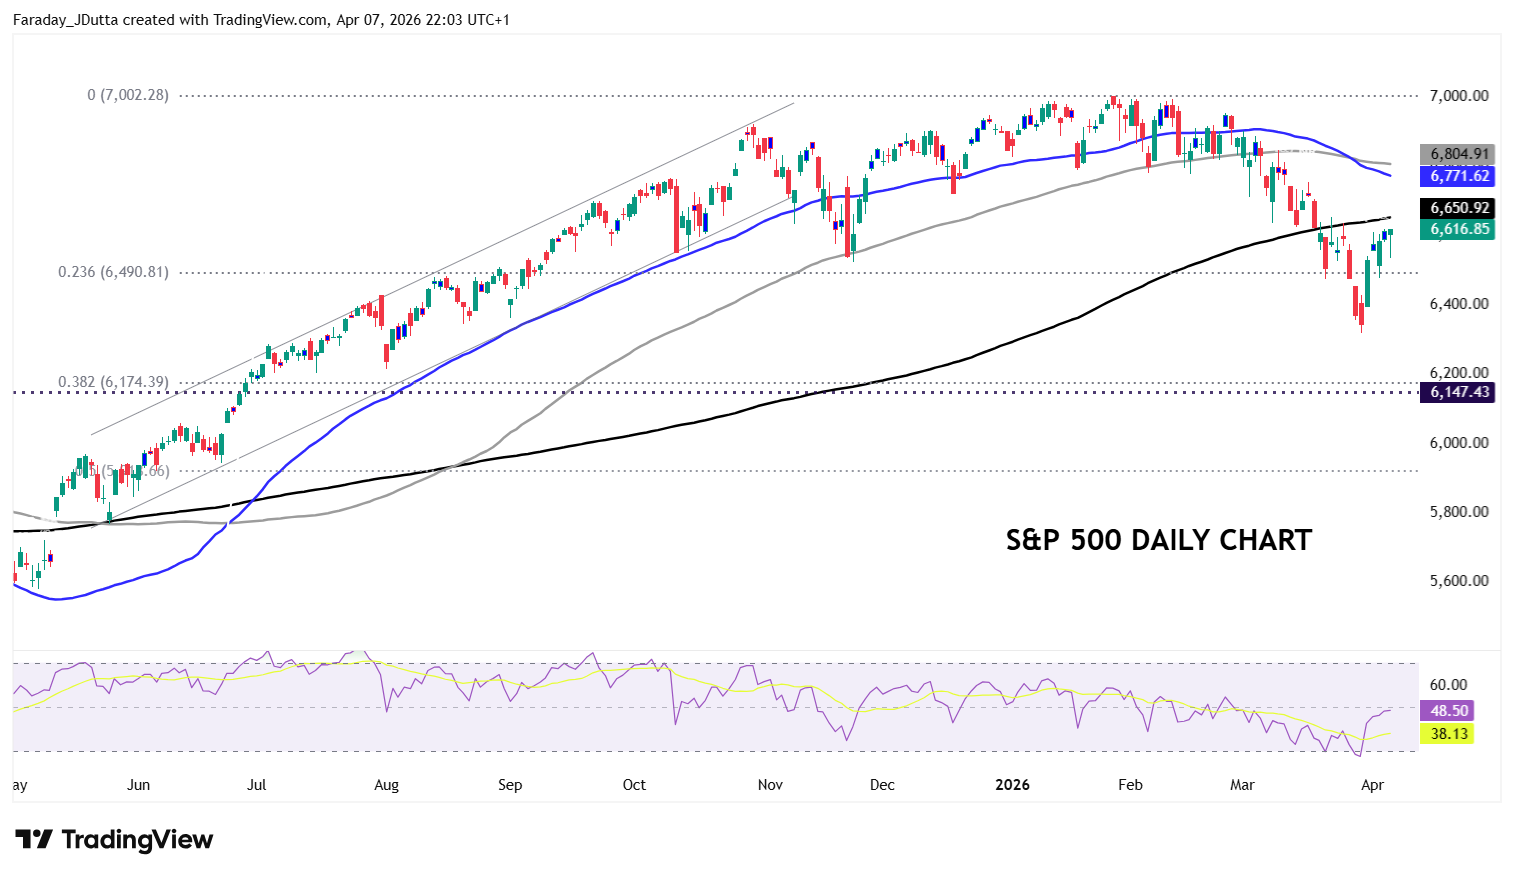
Chart of the Day – S&P 500 bouncing
With the underlying assumptionof a ceasefire and/or broader stabilization, risk assets are off their recent lows. A ceasefire would imply a partial (if not full) reopening of the Strait of Hormuz, easing constraints on global energy supply. For stocks, cyclicals have unsurprisingly outperformed from the trough. More notably, however, volatility has declined across regions and asset classes, reinforcing the notion that investors are trying to look through the near-term noise. The recent bottom is 6,316 with the major Fib level (38.2%) of the Liberation Day low to the record high at 6,174. The February high reinforces this area at 6,147. The minor retracement level sits at 6,490 while the 200-day SMA resides above at 6,650 and the 50-day SMA at 6,771.