Important Information
You are visiting the international Vantage Markets website, distinct from the website operated by Vantage Global Prime LLP
( www.vantagemarkets.co.uk ) which is regulated by the Financial Conduct Authority ("FCA").
This website is managed by Vantage Markets' international entities, and it's important to emphasise that they are not subject to regulation by the FCA in the UK. Therefore, you must understand that you will not have the FCA’s protection when investing through this website – for example:
- You will not be guaranteed Negative Balance Protection
- You will not be protected by FCA’s leverage restrictions
- You will not have the right to settle disputes via the Financial Ombudsman Service (FOS)
- You will not be protected by Financial Services Compensation Scheme (FSCS)
- Any monies deposited will not be afforded the protection required under the FCA Client Assets Sourcebook. The level of protection for your funds will be determined by the regulations of the relevant local regulator.
If you would like to proceed and visit this website, you acknowledge and confirm the following:
- 1.The website is owned by Vantage Markets' international entities and not by Vantage Global Prime LLP, which is regulated by the FCA.
- 2.Vantage Global Limited, or any of the Vantage Markets international entities, are neither based in the UK nor licensed by the FCA.
- 3.You are accessing the website at your own initiative and have not been solicited by Vantage Global Limited in any way.
- 4.Investing through this website does not grant you the protections provided by the FCA.
- 5.Should you choose to invest through this website or with any of the international Vantage Markets entities, you will be subject to the rules and regulations of the relevant international regulatory authorities, not the FCA.
Vantage wants to make it clear that we are duly licensed and authorised to offer the services and financial derivative products listed on our website. Individuals accessing this website and registering a trading account do so entirely of their own volition and without prior solicitation.
By confirming your decision to proceed with entering the website, you hereby affirm that this decision was solely initiated by you, and no solicitation has been made by any Vantage entity.
I confirm my intention to proceed and enter this website Please direct me to the website operated by Vantage Global Prime LLP, regulated by the FCA in the United KingdomBy providing your email and proceeding to create an account on this website, you acknowledge that you will be opening an account with Vantage Global Limited, regulated by the Vanuatu Financial Services Commission (VFSC), and not the UK Financial Conduct Authority (FCA).
-
Please enter a valid email address
-
Please tick the checkbox to proceed
-
Please tick the checkbox to proceed
Please tick all to proceed
Access Restricted
Your access to this website is restricted.
Our website and services are not available to, and are not intended for, individuals who are citizens or residents of the United States, or entities incorporated in or conducting business within the United States.
If this does not apply to you and you believe you have received this message in error, please contact us at [email protected] for further assistance.
If you fall into any of the above categories, please exit the site.
Important Information
Thank you for visiting the Vantage Markets website. Please note that this website is intended for individuals residing in jurisdictions where accessing it is permitted by Vantage and its affiliated entities do not operate in your home jurisdiction.
By clicking 'I CONFIRM MY INTENTION TO PROCEED AND ENTER THIS WEBSITE', you confirm that you are entering this website solely based on your initiative and not as a result of any specific marketing outreach. You wish to obtain information from this website based on reverse solicitation principles, in accordance with the applicable laws of your home jurisdiction.
I CONFIRM MY INTENTION TO PROCEED AND ENTER THIS WEBSITE-
Search query too short. Please enter a full word or phrase.
-

Keywords
- Forex Trading
- Vantage Rewards
- Trading Fees
Popular Search
- Trading Accounts
- MT4
- MT5
- TradingView
- Promotions
Explore More About Indices Trading
-

What are Indices
Learn what indices are, how they work, and their importance in financial markets and trading.
-
How to Trade Indices
Find out how to trade indices with CFDs, and the advantages trading indices can offer.
-
Why Trade Indices
Discover the key benefits of indices trading, including diversification, lower capital requirements, and exposure to broader market trends.


Award-Winning Broker
-

Most Innovative
BrokerFX Broker Tester
-
Best CFD
BrokerGlobal Brands Magazine
-
Best APAC
Region BrokerADVFN International Financial Awards

Trade Indices CFDS On Different Types Of Trading Platforms

MetaTrader 4
- 30 Built-in technical indicators
- 31 Analytical Charting Tools
- 9 Time-Frames
- 4 Types of trading orders

MetaTrader 5
- 38 Built-in technical indicators
- 44 Analytical Charting Tools
- 21 Time-Frames
- 6 Types of trading orders
TradingView
- 15+ chart types
- 100+ in-built indicators
- 50+ Drawing tools
- 12 alert conditions
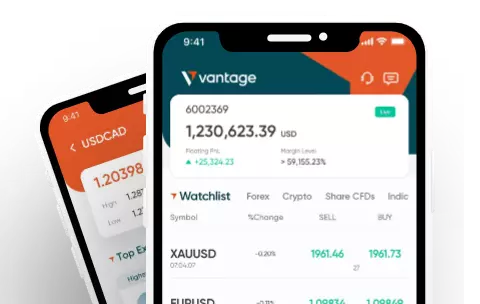
Vantage Mobile App
- 55 Deposit Methods Globally
- 220+ Daily Product Analysis
- 16 TradingView Indicators
- 80,000+ Copy Traders
Choose a Trading Account Based on Your Experience Level
-
1
Any level
-
2
Beginner Traders

For beginner traders looking for direct market access with no commissions.
- Tight spreads from 1.1 pip.
- No extra commissions on trading volume.
-
3
Experience Traders

Offering seasoned traders razor-sharp spreads, low commissions, and deep liquidity.
- Tight spreads from 0.0 pip.
- Commisssions from USD$3.00 per standard lot, per side.
-
4
Professional Traders

For professional traders and money managers who trade large volumes.
- Tights spreads from 0.0 pip.
- Commissions from USD$1.50 per standard lot, per side.