Note: The companies mentioned are discussed for informational purposes only. References to these shares do not constitute a recommendation to buy, sell, or trade them via CFDs or any other product.
Large cap stocks are shares of companies with a market capitalisation above USD 10 billion — established businesses that dominate global indices, generate consistent cash flows, and form the core of most institutional portfolios [1].
In 2026, the landscape is led by a tight group of technology companies, with Nvidia, Alphabet, Apple, Microsoft, and Amazon holding the top five positions globally by market capitalisation.
A sixth name joined them on 12 June 2026, when SpaceX listed on the Nasdaq in what was the largest IPO in stock market history — raising $75 billion and reaching a market cap of approximately $2.5 trillion within days of its debut.
Each of these companies has been reshaped by the artificial intelligence boom, and each brings a distinct financial profile and risk exposure.
This article explains what large cap stocks are, how they compare to mid and small cap stocks, what distinguishes the leading names in 2026, and what risks are relevant when speculating on these markets through stock CFDs.
Key Points
- Large cap stocks are companies with a market capitalisation above USD 10 billion. They represent fewer than 15% of listed US companies by number but account for over 80% of total market value [2].
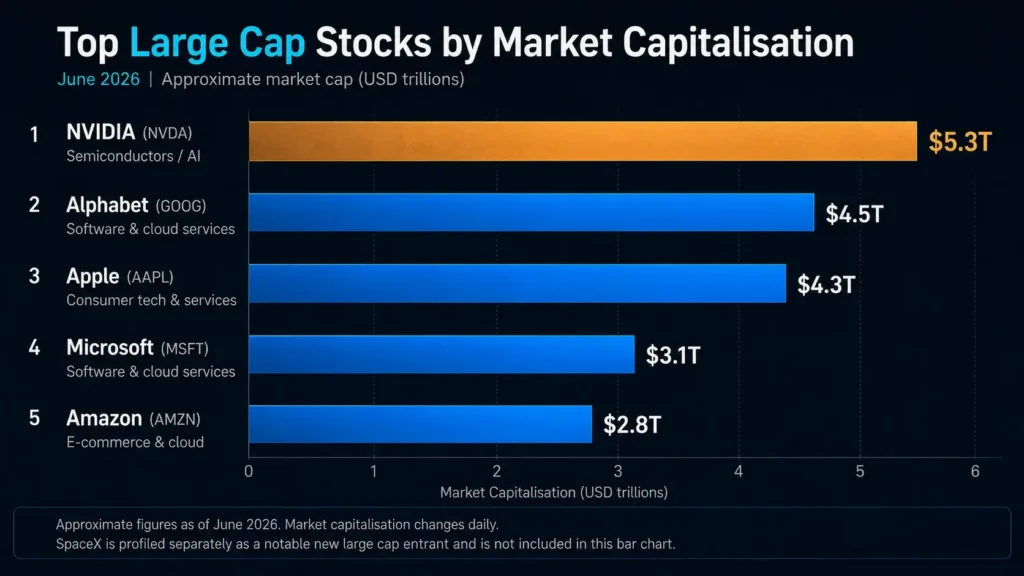
- The top five global large caps by market cap in June 2026 are Nvidia (~USD 5.3 trillion), Alphabet (~USD 4.5 trillion), Apple (~USD 4.3 trillion), Microsoft (~USD 3.1 trillion), and Amazon (~USD 2.8 trillion) — a ranking that has shifted materially since 2025 as AI-driven gains reshaped valuations [3].
- Despite their scale, large cap stocks carry meaningful risks in 2026, including elevated P/E valuations, geopolitical uncertainty, and growing scrutiny over whether AI-related capital expenditure will generate sufficient returns.
- SpaceX (SPCX) listed on Nasdaq on 12 June 2026 in the largest IPO in history, raising $75 billion and reaching a market cap of approximately $2.5 trillion within days. It is a notable case study in growth-driven large cap valuation: the company operates at a net loss, has no P/E ratio, and is priced almost entirely on future potential — a different model from the earnings-generating incumbents profiled alongside it.
What Are Large Cap Stocks?
A large cap stock is a share issued by a company with a total market capitalisation of USD 10 billion or more. Market capitalisation — often shortened to “market cap” — is calculated by multiplying the total number of outstanding shares by the current share price. The figure reflects the market’s aggregate assessment of a company’s size and value at a given point in time.
Depending on their market capitalisation, equities can be divided into several types of stocks, including large cap, mid cap, and small cap shares:
| Category | Market Cap Range |
| Large cap stock | USD 10 billion or more |
| Mid cap stock | USD 2 billion – USD 10 billion |
| Small cap stock | USD 250 million – USD 2 billion |
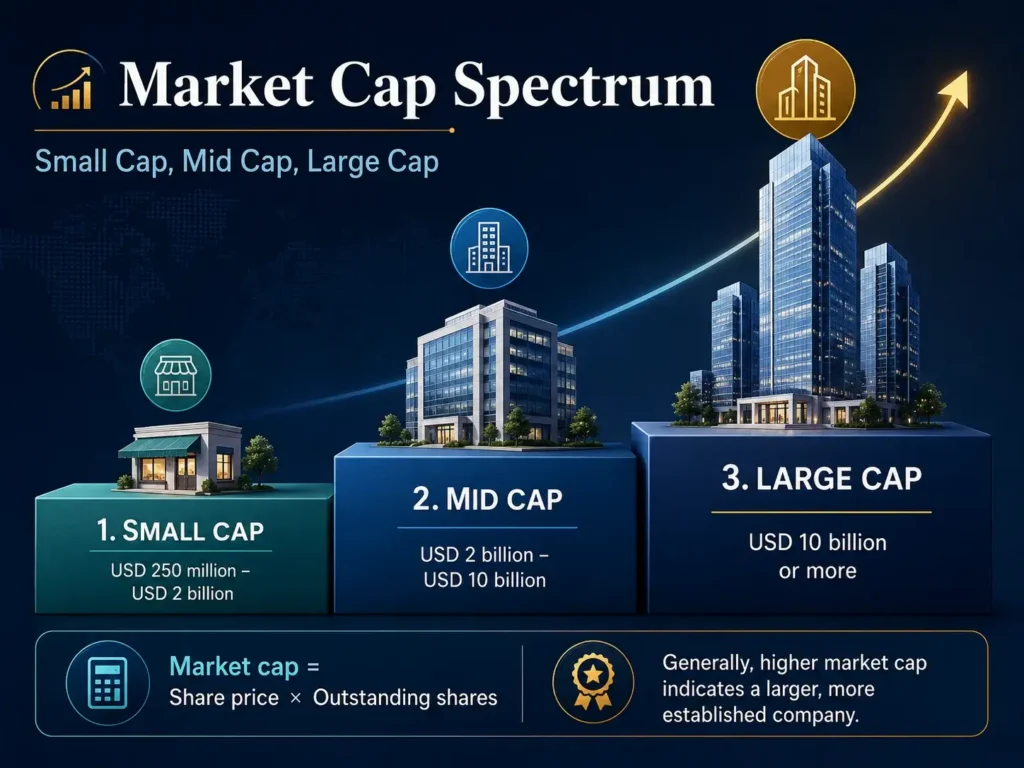
These thresholds are widely accepted benchmarks, though definitions can vary by index provider or region. Larger capitalisation generally corresponds to a more established company with deeper liquidity and a longer operating history.
Large Cap, Mid Cap, and Small Cap Stocks Compared
Market capitalisation is one factor separating these stock categories, but the distinctions run deeper — covering growth potential, volatility, and the type of investor they attract.
Large cap stocks are the most mature category. Companies at this scale tend to have established business models, global market presence, and regular dividend programmes. Their stability makes them less volatile than smaller peers during downturns, though that same maturity means explosive growth is less common.
Apple and Microsoft illustrate the pattern: steady earnings compounders that grow through innovation and acquisition. Nvidia is the exception — a large cap that has grown at a pace more commonly associated with small caps, driven by an extraordinary alignment between its products and the AI investment cycle.
Mid cap stocks are typically in a growth phase — still actively expanding, reinvesting profits into new markets or capabilities. Small caps sit at the speculative end: higher potential, but sharper drawdowns during broad market pullbacks and slower recoveries.
Why Large Cap Stocks Attract Investors
Four characteristics make large cap stocks a common anchor in diversified portfolios.
- Stability Under Pressure: Large cap companies generally have substantial financial resources and diversified revenue bases. During broader market downturns, they may experience less volatility than smaller peers, although this is not guaranteed. Their presence in major indices also helps explain how mega-cap technology stocks shape the S&P 500 and other market-capitalisation-weighted benchmarks.
- High liquidity: Large cap stocks are among the most actively traded shares on global exchanges, with tight bid-ask spreads and deep order books. This makes them straightforward to enter and exit, even in volatile conditions — a feature that matters particularly when managing risk in fast-moving markets.
- Institutional weight: According to the American Association of Individual Investors (AAII), large cap stocks represent over 80% of the total value of the US stock market despite accounting for less than 15% of listed companies by number [2]. That concentration means institutional fund flows — from pension funds, sovereign wealth funds, and passive ETFs — create persistent demand that supports prices in normal conditions.
- Dividend income: Many established large cap companies return capital to shareholders through quarterly dividends and share buyback programmes. This provides a recurring cash return alongside any capital appreciation, and historically it has reduced the volatility of total returns during market corrections.
Traders can access the price movements of large cap companies through stock CFDs without owning the underlying shares. CFDs are derivative instruments and do not confer ownership of the underlying shares. Stock CFD positions can be opened in either direction, although leverage magnifies both potential gains and potential losses.
Top Large Cap Stocks to Watch in 2026
The table below summarises the five largest public companies globally by market capitalisation as of June 2026. SpaceX — which listed on Nasdaq on 12 June 2026 — is profiled separately after them as a notable new entry to the large cap landscape.
| Stock | Market Cap (Jun 2026, USD) | Sector | Latest Revenue (TTM) | P/E Ratio (approx.) |
| Nvidia (NVDA) | ~$5.3 trillion | Semiconductors / AI | ~$297B* | ~45–50 |
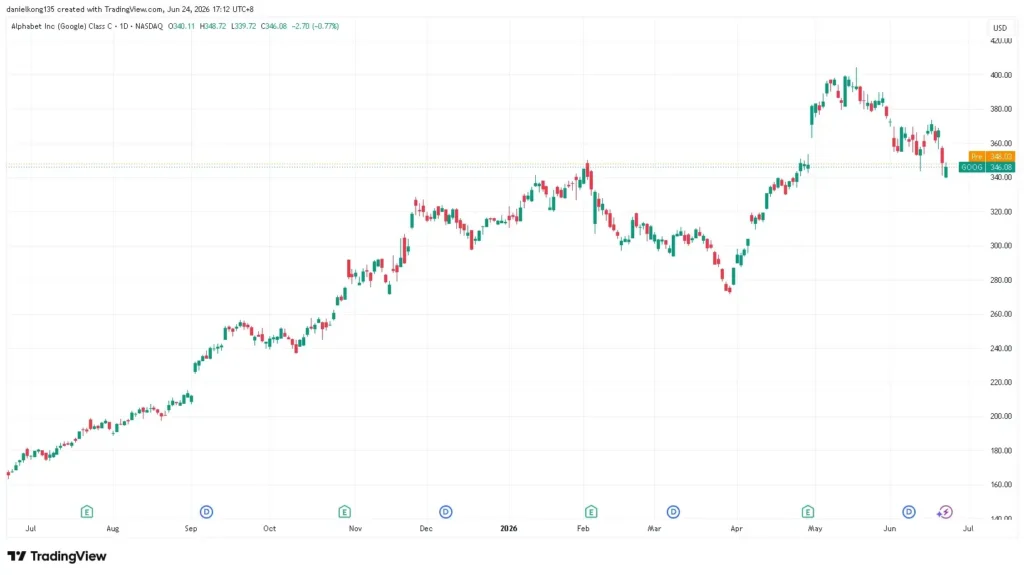
| Alphabet (GOOG) | ~$4.5 trillion | Software & cloud services | ~$371B | ~22–25 |
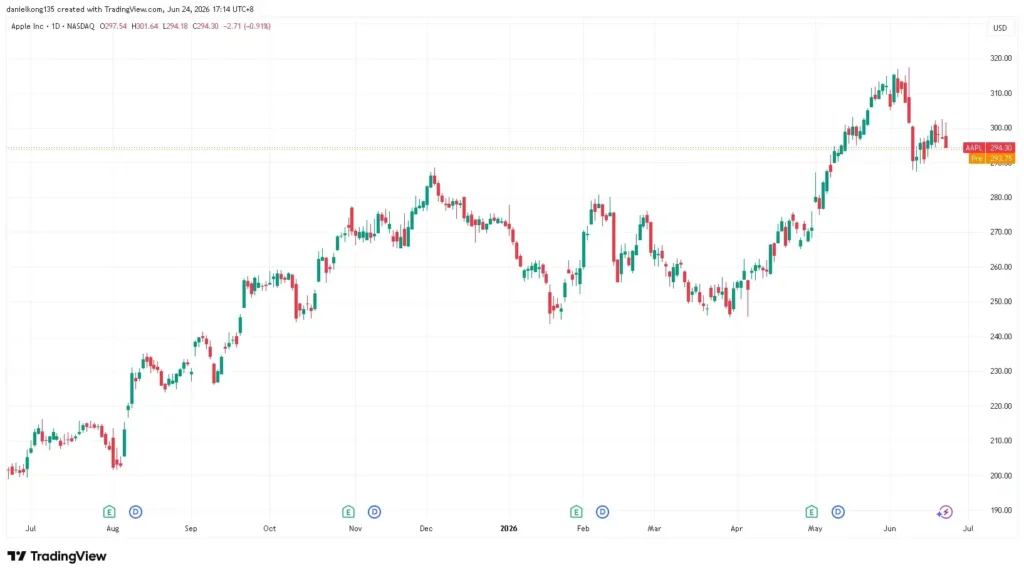
| Apple (AAPL) | ~$4.3 trillion | Consumer tech & services | ~$408B | ~32–35 |
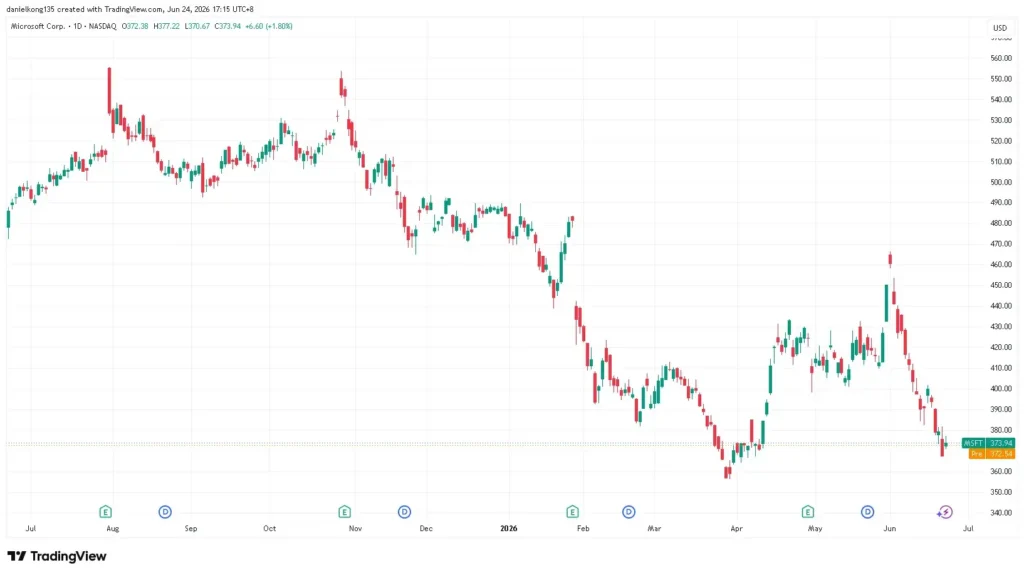
| Microsoft (MSFT) | ~$3.1 trillion | Software & cloud services | ~$282B | ~33–36 |
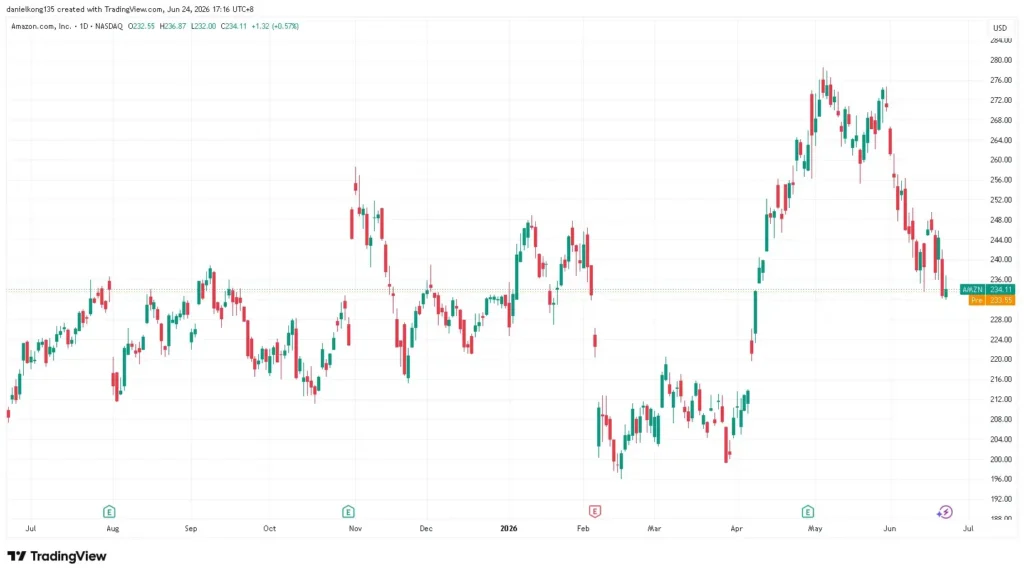
| Amazon (AMZN) | ~$2.8 trillion | E-commerce & cloud | ~$670B | ~34–36 |
Note: Past financial performance and valuations are provided for informational purposes only and do not indicate future results.
Each of the following profiles examines how the company reached its current position, the financial results driving its valuation, and the specific factors shaping its outlook for the rest of 2026. SpaceX is profiled after the top five as a distinct case study — it listed just days before this article was written and represents a different valuation model from the five established incumbents.
Nvidia (NVDA)
Company overview
Nvidia designs and manufactures graphics processing units (GPUs) and AI accelerator hardware. Once primarily associated with gaming, the company has been fundamentally reshaped by the artificial intelligence boom. Its data centre products are now the infrastructure backbone for training and running large language models, and demand for its Blackwell architecture chips has driven extraordinary revenue growth.
Financial highlights [3,4]
Nvidia’s full fiscal year 2026 (ending January 2026) generated record annual revenue of USD 215.9 billion, up 65% from the prior year, driven primarily by data centre demand. In the first quarter of its next fiscal year (Q1 FY2027, February–April 2026), the company extended that momentum with quarterly revenue of USD 81.6 billion — up 85% year on year. Data centre revenue in the quarter reached USD 75.2 billion, up 92%, with demand from hyperscalers and a rapidly diversifying customer base of AI cloud providers, industrial clients, and sovereign buyers.
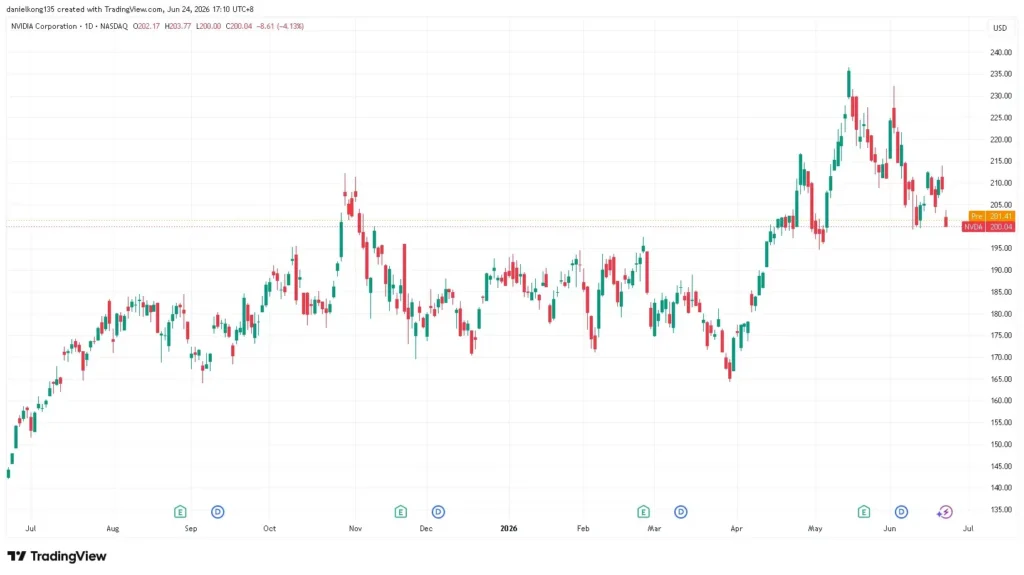
As of June 2026, Nvidia’s market capitalisation stands at approximately USD 5.3 trillion, making it the world’s most valuable publicly listed company.
Growth outlook
The Nvidia stock outlook remains closely tied to demand for its Blackwell architecture, the expansion of AI infrastructure, and restrictions affecting advanced chip exports.
CEO Jensen Huang described the current phase as an “agentic AI inflection point” driving substantial growth in computing demand. [4] Blackwell production is increasing, while NVLink networking products extend Nvidia’s revenue opportunities beyond chips alone.
Two risks temper the outlook: the stock’s elevated P/E embeds growth expectations that leave little room for disappointment, and restrictions on advanced AI chip exports to China — resulting in zero Hopper shipments in Q1 FY2027 — represent a continuing regulatory headwind.
Alphabet (GOOG)
Company overview
Alphabet is the holding company for Google — the world’s dominant search engine — along with YouTube, Google Cloud, Waymo (autonomous vehicles), and a range of other businesses. In 2026, Alphabet has emerged as one of the strongest performers in the Magnificent Seven, driven by acceleration in both search and cloud, supported by the integration of its Gemini AI model across its product stack.
Financial highlights [3,5]
Alphabet’s Q1 2026 delivered net income growth of 81% year on year, with earnings per diluted share reaching USD 5.11. Google Search revenue grew 19%, while Google Cloud surged 63% — cloud backlog nearly doubling quarter on quarter to over USD 460 billion . As of June 2026, Alphabet’s market cap stands at approximately USD 4.5 trillion, placing it second globally — up from fourth place as recently as late 2025, when it sat at approximately USD 2.5 trillion.
Growth outlook
The Alphabet stock outlook is shaped by Google Search performance, Google Cloud growth, Gemini adoption, and the scale of the company’s continuing AI investment.
CEO Sundar Pichai attributed 2026’s strong start to Alphabet’s “full-stack AI approach” across infrastructure, research, and consumer products [5]. Gemini now supports over 350 million paid subscriptions, and Google’s custom TPU chips represent a long-run revenue stream that could compete with Nvidia in AI infrastructure.
The main near-term risk is the April 2026 announcement of an USD 80 billion equity raise to fund data centres — an amount that raised investor concern about dilution and capital deployment discipline.
Apple (AAPL)
Company overview
Apple’s competitive advantage rests on its integrated hardware-software-services model: iPhone, Mac, iPad, and a growing Services layer built on brand loyalty and premium pricing power. Apple Intelligence, its AI integration framework, is being deployed incrementally across iOS and macOS.
Financial highlights [6]
Apple’s fiscal Q2 2026 (January–March 2026) delivered revenue of USD 111.2 billion, up 17% year on year, with iPhone revenue growing 22% to USD 57 billion — its most popular lineup in the company’s history. Revenue from Greater China jumped 28%, reversing a competitive headwind that had concerned analysts a year earlier. As of June 2026, Apple’s market cap is approximately USD 4.3 trillion, placing it third globally [3,6].
Growth outlook
The Apple stock outlook depends on iPhone demand, Services growth, the development of Apple Intelligence, and ongoing regulatory proceedings.
Management guided fiscal Q3 2026 revenue growth of 14–17%, ahead of consensus. The Services segment — App Store, iCloud, Apple TV+, Apple Pay — delivers high-margin revenue that is less dependent on hardware cycles.
The risk: Apple spends substantially less on AI data centre infrastructure than Microsoft and Alphabet, which could constrain its positioning if cloud-based AI becomes central to device value. A pending US Department of Justice antitrust case on smartphone market conduct represents a longer-term structural risk.
Microsoft (MSFT)
Company overview
Microsoft operates across three segments: Productivity and Business Processes (Microsoft 365, Teams, LinkedIn), Intelligent Cloud (Azure), and More Personal Computing (Windows, Xbox). Azure is the central growth battleground against Amazon Web Services and Google Cloud; the company holds a significant stake in OpenAI and has built AI capabilities across its products under the Copilot brand.
Financial highlights [7]
In Q3 FY2026 (January–March 2026), Microsoft reported revenue of approximately USD 81.4 billion, up around 16% year on year, with Azure cloud growth running at 26–27% per quarter. As of June 2026, Microsoft’s market cap stands at approximately USD 3.1 trillion — down from its 2025 peak as investors weighed the return on the company’s AI capital expenditure programme.
Growth outlook
The Microsoft stock outlook is closely tied to Azure growth, Copilot adoption, and whether its substantial AI capital expenditure generates sufficient additional revenue.
Microsoft’s disclosed USD 190 billion capital expenditure plan for 2026 triggered a 4% single-day stock decline when announced, as investors questioned whether AI-driven revenue growth justifies the spending pace [8].
Azure is expected to re-accelerate as capacity constraints from 2025 ease with new data centres coming online, though questions about differentiation from Google Cloud — which has shown stronger recent momentum — persist.
Amazon (AMZN)
Company overview
Amazon spans e-commerce, cloud computing (Amazon Web Services), digital advertising, logistics, and healthcare. AWS is the primary driver of margin and has historically been the most profitable business segment. After a period of relative underperformance among the Magnificent Seven in 2025, Amazon has been the standout momentum name early in 2026, driven primarily by AWS returning to accelerating growth.
Financial highlights [9]
Amazon’s most recent quarterly results showed AWS posting its fastest sales growth in more than three years, according to reporting by Fortune. Across the business, Prime membership grew 9% year on year in the prior period, while advertising revenue spiked 18% — demonstrating the company’s ability to monetise its consumer audience beyond transactions alone. As of June 2026, Amazon’s market capitalisation stands at approximately USD 2.8 trillion, placing it fifth globally.
Growth outlook
The Amazon stock outlook centres on AWS growth, improving e-commerce margins, advertising revenue, and the costs associated with AI and logistics expansion.
Amazon has been characterised by some analysts as a “catch-up trade” — a company where AWS momentum and efficiency gains from warehouse automation are beginning to be priced in after a period of scepticism. The AWS growth acceleration, combined with improving e-commerce margins from logistics automation, supports the bull case.
Risks include heavy capital expenditure commitments across AI and logistics, competitive pressure in cloud from both Azure and Google Cloud, and uncertainty around expansion into healthcare and other new verticals.
SpaceX (SPCX) — A Case Study in Growth-Driven Valuation
Company overview
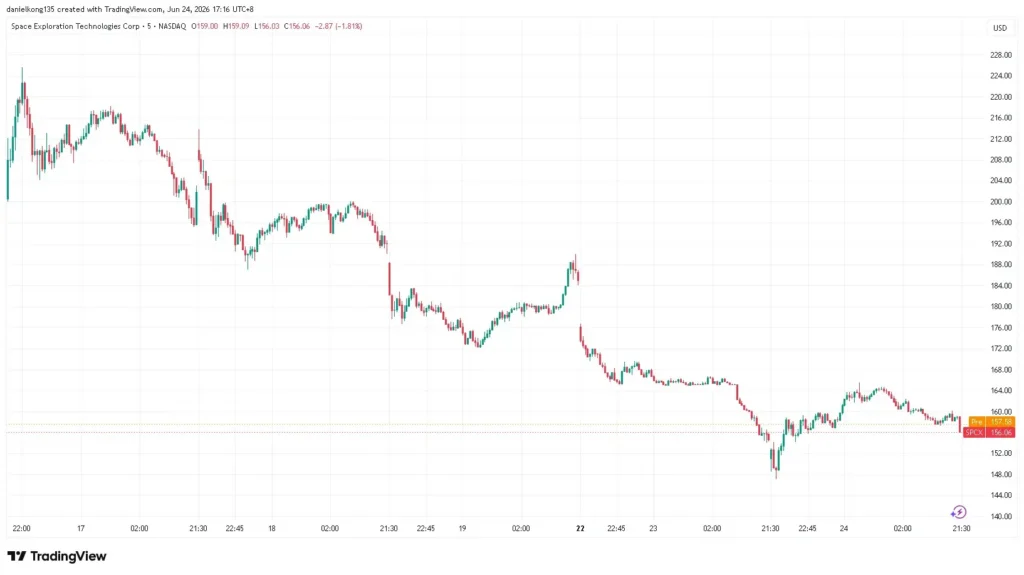
SpaceX is reported to have listed on the Nasdaq under the ticker SPCX on 12 June 2026, completing the largest initial public offering in stock market history at USD 75 billion and an offer price of USD 135 per share [13].
According to cited reports, the stock closed its first day at $160.95 (+19%) and had risen to approximately $192 by 18 June 2026, placing its market cap at roughly USD 2.5 trillion — among the top six public companies globally [14]. SpaceX is described in reports as operating three segments: Connectivity (Starlink satellite internet), Space (rocket launch services), and AI (xAI, including the Grok model and the X platform — merged into SpaceX in February 2026).
Financial highlights [15, 16]
For full-year 2025, SpaceX reported consolidated revenue of USD 18.7 billion (+33% year on year). Starlink is the financial engine — generating USD 11.4 billion (61% of total revenue) and USD 4.4 billion in operating income for the year, with 10.3 million active subscribers as of March 2026, up from 2.3 million in 2023. The Space and AI segments both ran at operating losses; the AI segment alone recorded a USD 6.35 billion operating loss in 2025, pulling the company into net loss territory overall. SpaceX has no P/E ratio (EPS is approximately -$2.94 on a trailing basis) and trades at roughly 94 times annual revenue — priced on future potential, not current earnings.
What makes SpaceX a distinctive case study
SpaceX is often used as a case study of a valuation model that sits apart from the five profitable incumbents above. Morningstar estimates fair value at approximately USD 780 billion — less than one-third of its current trading price — based on conservative assumptions about Starlink growth and xAI monetisation. ARK Invest projects USD 3.1 trillion by 2030. That disagreement reflects the gap between what Starlink earns today and what the broader business — orbital AI compute, Starship commercialisation, and xAI — could theoretically deliver.
Risks
Three risks are commonly cited: xAI is a heavy cash consumer with Starlink profits currently subsidising its build-out; Starlink faces rising competition from Amazon’s Project Kuiper, Eutelsat OneWeb, and Blue Origin’s planned constellation; and as a newly public company with no trading history, post-IPO price volatility as institutional holders establish positions is a near-term risk absent in longer-established large caps.
Note: SpaceX listed on 12 June 2026. All figures as at 18 June 2026. IPO-stage companies typically carry higher uncertainty than established large caps. This profile is for educational purposes only.
How to Evaluate Large Cap Stocks: Key Valuation Metrics
Valuation metrics give traders and investors a structured way to compare large cap stocks against one another. The same number can signal very different things depending on the sector: a P/E of 15 is elevated in utilities but modest in software, while a P/B below 1.0 means something different in financials than in consumer technology. Three metrics are most widely used — P/E ratio, P/B ratio, and market capitalisation trends.
P/E Ratio, P/B Ratio, and Market Capitalisation
P/E ratio (Price to Earnings)
The P/E ratio measures a stock’s price relative to its earnings per share. A P/E of 30 means investors are paying USD 30 for each dollar of current earnings — pricing in future growth that justifies the premium. The NASDAQ composite’s average P/E is a useful benchmark for tech-heavy large caps; a stock trading well above it is priced for stronger-than-average growth, which becomes fragile if earnings disappoint.
P/B ratio (Price to Book)
The P/B ratio compares a stock’s market price to its net asset value per share. A P/B below 1.0 can indicate undervaluation — the market is pricing the company at less than its assets. Most large cap technology stocks carry P/B ratios well above 1.0, reflecting the market’s pricing of intangible assets — brand equity, software, data — that don’t appear on the balance sheet. In traditional sectors like financials and energy, a P/B near 1.0 may indicate genuine value rather than distress.
Market capitalisation trends
Beyond static metrics, tracking how market capitalisation has shifted over time reveals changes in investor conviction. Alphabet’s market cap moving from approximately USD 2.5 trillion in late 2025 to roughly USD 4.5 trillion by mid-2026 reflects a fundamental reassessment of its AI competitive positioning. Microsoft’s decline from its 2025 peak over the same period reflects the opposite dynamic — investors questioning capital allocation discipline. These shifts matter for CFD traders because they often signal sustained directional momentum rather than short-term noise.
Large Cap Stocks With Low P/E Ratios
Not all large cap stocks trade at premium valuations. Investors who favour value-oriented approaches often screen for large cap companies where the P/E ratio is below sector averages — a signal that the stock may be underpriced relative to its current earnings. This approach applies a straightforward filter: if a company’s earnings power is not fully reflected in its share price, a re-rating may follow once investor attention shifts.
Sectors commonly associated with lower P/E large caps include energy (major oil and gas producers), traditional financials (large banks and insurance companies), and established healthcare and pharmaceutical firms. Unlike high-growth technology names, these businesses are priced more closely to current earnings because their near-term growth trajectories are more predictable and less transformative.
When evaluating low-P/E large caps, several factors warrant attention:
- Earnings quality: Is the low P/E a result of genuinely strong earnings, or distorted by a one-off gain or asset sale?
- Sector context: A P/E of 10 may be expensive in utilities but typical in financials and low in software. Cross-sector comparisons without this context can mislead.
- Debt load: A low P/E combined with heavy borrowing may signal financial risk rather than undervaluation. Scrutinise the balance sheet alongside the income statement.
- Dividend yield: Low-P/E large caps often pay higher dividends, effectively returning part of the expected return upfront rather than through price appreciation.
Value screens typically flag US large caps with P/E ratios below 15 as notable, and below 10 as particularly low. Stocks consistently found in the latter range in 2026 include major energy producers and traditional financial institutions — names where cash flow generation is strong but growth expectations are limited. Alphabet has also historically traded at a P/E discount relative to its Magnificent Seven peers, which some analysts have interpreted as a persistent undervaluation.
Note: P/E ratios change daily with stock prices and quarterly earnings. The examples above are for educational context only and do not constitute a recommendation to trade any specific security.
Market Outlook for Large Cap Stocks in 2026
Large cap company revenues, margins, and valuations all respond to the same macro forces: economic growth rates, interest rate policy, sector rotation, and geopolitical developments. In 2026, several of those forces are pulling in different directions at once. The sections below examine the global macroeconomic picture, current sector dynamics, and the specific risk factors most relevant to these markets.
Global Economic Conditions
The global economy in 2026 is navigating several simultaneous pressures. The IMF’s April 2026 World Economic Outlook revised its global growth forecast from 3.3% to 3.1%, citing the outbreak of conflict in the Middle East as the primary drag — with the associated rise in energy prices putting upward pressure on inflation [10]. Global headline inflation is projected at 4.4% in 2026 under the IMF’s reference forecast, a sharp departure from the declining trajectory of 2024–25.
For large cap companies, this environment creates competing forces. Slower global growth may reduce consumer and business demand in overseas markets, potentially compressing top-line growth for multinationals. On the other side, central banks in several advanced economies are expected to maintain accommodative policies to support activity, which tends to support equity valuations by lowering the discount rate on future earnings. The US economy is projected to grow approximately 2.4% in 2026 [11].
Sector Performance and AI Rotation
Technology stocks have dominated large cap market performance over recent years, supported by capital expenditure and revenue expectations linked to artificial intelligence. However, that dominance is showing signs of narrowing in 2026.
Earnings growth for the Magnificent Seven group is projected at approximately 18% for the year — meaningful, but only marginally ahead of the broader S&P 500’s projected 13% growth, according to Bloomberg Intelligence [9]. The spread has compressed significantly compared to recent years.
This convergence may be contributing to some reallocation from technology into other large cap sectors. Defence companies have emerged as notable beneficiaries as geopolitical risk drives government procurement. Energy companies have gained on higher commodity prices. Financials are benefiting from a steeper yield curve in some markets.
Within technology, performance across individual names has diverged. Alphabet and Amazon have led in 2026, while Microsoft has underperformed as investors question the return on its AI capital expenditure.
The SpaceX IPO in June 2026 added a further data point: despite the company operating at a net loss, its $75 billion raise and instant $2.1 trillion first-day valuation showed that investor appetite for large-scale technology growth stories remains substantial — even when current earnings do not exist [13].
Key Risks to Watch
Several risks are particularly relevant to large cap stocks in the current environment.
- AI investment payoff uncertainty. The world’s five largest companies are collectively spending hundreds of billions annually on AI infrastructure. The IMF’s April 2026 WEO named “a reassessment of AI-driven productivity expectations” as one of the primary downside risks to global growth — an outcome that would disproportionately reprice technology-heavy large cap portfolios. [10]
- Geopolitical disruption. The Middle East conflict has directly affected energy prices and global supply chains. IMF research has found that geopolitical risk events are associated with average monthly stock market declines of approximately 1% globally, and up to 2.5% in emerging market economies. [12] The conflict’s duration and scope remain uncertain.
- Regulatory pressure. Technology giants face ongoing antitrust scrutiny in the United States and European Union. Apple, Alphabet, and Amazon are all subject to significant active proceedings. Adverse rulings can force structural changes, generate large financial penalties, or constrain future business models.
- Elevated valuations. With the S&P 500 P/B ratio at levels comparable to those seen near the 2000 dotcom bubble peak, high earnings expectations are embedded in prices across broad market indices. When expectations are already priced in, any earnings shortfall or forward guidance reduction can trigger sharp corrections — particularly in high-multiple technology names.
Risks When Speculating on Large Cap Stock CFDs
Trading large cap stock CFDs — Contracts for Difference — allows speculative access to these companies’ price movements without taking ownership of the underlying shares. Positions can be opened in either direction.
While large caps are generally less volatile than mid or small cap peers, that relative stability does not eliminate the specific risks that arise from CFD mechanics, elevated valuations, or fast-moving macro events.
These considerations should form part of a broader set of risk management techniques, including appropriate position sizing, monitoring margin requirements, and understanding how orders may behave during volatile market conditions.
Valuation and Market Volatility Risks
Several of the largest large cap companies carry elevated P/E ratios anchored to AI-driven growth expectations. If that growth disappoints — or if a major earnings miss triggers repricing — the resulting volatility can be sharp. A CFD position on an overvalued stock carries the specific risk of large, rapid mark-to-market losses, amplified further by any leverage applied.
Macro and geopolitical events add a separate layer of volatility. Conflict escalation, central bank rate decisions, and unexpected trade policy shifts can generate sudden large moves in major indices and individual names simultaneously.
Sector-Specific Risks
Each large cap sector carries a distinct risk profile. Technology large caps face regulatory risk as frameworks around AI governance, data privacy, and market competition continue to evolve — adverse outcomes can affect business models with limited warning. Industrial large caps are more sensitive to supply chain disruption and cyclical demand swings. Consumer staples large caps face margin pressure from rising input costs and changing consumer behaviour.
Concentrating CFD exposure in a single sector — for example, holding positions across multiple Magnificent Seven names simultaneously — means that sector-level shocks affect multiple positions at once. Spreading exposure across sectors is a common approach to managing that concentration risk.
Monitoring Macro Conditions and Earnings Events
Positions held around major earnings season announcements, central bank decisions, or geopolitical developments may carry heightened gap risk—the possibility that a stock opens substantially above or below its previous closing price, potentially bypassing the level at which a stop-loss order was placed.
Monitoring economic data releases, earnings calendars, and geopolitical developments is a basic discipline for managing large cap CFD exposure. Understanding the specific earnings drivers of each company — revenue growth by segment, margin trajectory, and forward guidance — provides a foundation for assessing whether a position’s risk-reward balance remains appropriate.
Apart from that, understanding the stock market trading hours is also important when holding positions across different exchanges. Market closures, after-hours announcements, and differences between regional sessions can affect when new information is reflected in a company’s share price.
This section is for educational purposes only. It does not constitute investment or financial advice. CFD trading carries significant risk of loss, and leverage can amplify losses beyond the initial deposit.
Understanding Large Cap Stocks in 2026
Large cap stocks remain central to global markets in 2026. They combine the scale and liquidity that institutional portfolios require with direct exposure to the technology and AI themes driving this economic cycle. Nvidia’s extraordinary revenue growth, Alphabet’s cloud acceleration, and Apple’s resilient consumer franchise all represent genuine business performance — not just narrative.
Their scale offers relative stability, but not immunity from correction, regulatory disruption, or the valuation risk that builds over a prolonged bull market. Elevated P/E multiples, a narrowing earnings growth premium for the Magnificent Seven, and a geopolitically volatile macro backdrop all mean these companies warrant the same scrutiny as any other large investment-grade name.
Frequently Asked Questions
What is a large cap stock?
A large cap stock is a share issued by a company with a market capitalisation above USD 10 billion. Large cap companies are typically mature, established businesses with strong revenue bases, high liquidity, and a track record across multiple market cycles. The category spans from technology giants like Nvidia and Apple to energy majors, financial institutions, and pharmaceutical companies.
What are the top large cap stocks to watch in 2026?
As of June 2026, the five largest public companies by market capitalisation are Nvidia (~USD 5.3 trillion), Alphabet (~USD 4.5 trillion), Apple (~USD 4.3 trillion), Microsoft (~USD 3.1 trillion), and Amazon (~USD 2.8 trillion). All five are technology or technology-adjacent companies whose recent performance has been closely tied to the artificial intelligence investment cycle. The ranking has shifted materially since 2025: Alphabet has moved from fourth to second, while Microsoft has dropped from second to fourth.
What is a good P/E ratio for large cap stocks?
There is no universal threshold, as appropriate P/E ratios vary by sector and market conditions. For technology-heavy large caps, a P/E broadly in line with the NASDAQ composite average — which has run in the 30–36 range in recent periods — is a common reference. Stocks trading well above that level are priced for high growth; those below may reflect undervaluation or lower growth expectations. In traditional sectors such as energy and financials, P/E ratios below 15 are common.
How are large cap stocks different from mid cap and small cap stocks?
The primary difference is market capitalisation: large caps exceed USD 10 billion, mid caps range from USD 2–10 billion, and small caps are typically USD 250 million–USD 2 billion. In practice, the differences extend to stability (large caps tend to be less volatile), growth potential (small caps have more room to grow but at greater risk), liquidity (large caps are easier to trade at scale), and analyst coverage (large caps attract the most institutional research attention).
Are large cap stocks lower risk than other types of stocks?
Relatively, yes — but not without risk. Large cap stocks tend to be less volatile than mid or small cap peers because of their financial scale, diversified revenue bases, and high liquidity. They can still decline sharply during market corrections, earnings disappointments, or geopolitical shocks. CFD traders should also factor in leverage, which amplifies losses regardless of how large or well-established the underlying company is.
Which large cap stocks may be considered undervalued in 2026?
Undervaluation in large caps is typically identified through P/E ratios below sector averages, P/B ratios close to or below 1.0, or significant discounts to historical valuation ranges. In 2026, energy, financial, and healthcare large caps have generally traded at lower P/E multiples than the technology sector. These observations are for educational context only and do not constitute a recommendation to trade any specific security.
Can I access large cap stocks through Vantage?
Vantage offers stock CFDs on major large cap companies, allowing traders to speculate on share price movements without owning the underlying shares*. CFDs can be opened long (speculating on a price rise) or short (speculating on a price fall), and leverage is available — but it magnifies losses as well as gains. Traders should ensure they fully understand CFD mechanics and the risks of leverage before entering any position.
* Product availability and terms vary by jurisdiction. This content is not directed at residents of jurisdictions where such products are restricted or prohibited.
RISK WARNING: CFDs are complex financial instruments and carry a high risk of losing money rapidly due to leverage. You should ensure you fully understand the risks involved and carefully consider whether you can afford to take the high risk of losing your money before trading.
Disclaimer: The information is provided for educational purposes only and doesn’t take into account your personal objectives, financial circumstances, or needs. It does not constitute investment advice. We encourage you to seek independent advice if necessary. The information has not been prepared in accordance with legal requirements designed to promote the independence of investment research. No representation or warranty is given as to the accuracy or completeness of any information contained within. This material may contain historical or past performance figures and should not be relied on. Furthermore estimates, forward-looking statements, and forecasts cannot be guaranteed. The information on this site and the products and services offered are not intended for distribution to any person in any country or jurisdiction where such distribution or use would be contrary to local law or regulation.
References
- “Market Capitalization: What It Means for Investors – Investopedia” https://www.investopedia.com/terms/m/marketcapitalization.asp Accessed 18 June 2026
- “What Are Large-Cap Stocks? – American Association of Individual Investors” https://www.aaii.com/journal/article/14880-what-are-large-cap-stocks Accessed 18 June 2026
- “Largest Companies by Market Cap in 2026 – The Motley Fool” https://www.fool.com/research/largest-companies-by-market-cap/ Accessed 18 June 2026
- “NVIDIA Announces Financial Results for First Quarter Fiscal 2027 – SEC.gov” https://www.sec.gov/Archives/edgar/data/0001045810/000104581026000051/q1fy27pr.htm Accessed 18 June 2026
- “Alphabet Inc. First Quarter 2026 Earnings Release – SEC.gov” https://www.sec.gov/Archives/edgar/data/0001652044/000165204426000043/googexhibit991q12026.htm Accessed 18 June 2026
- “Amazon, Alphabet, Microsoft, Meta and Apple Just Reported Earnings – The Motley Fool” https://finance.yahoo.com/markets/stocks/articles/amazon-alphabet-microsoft-meta-apple-015200986.html Accessed 18 June 2026
- “Amazon, Alphabet, Microsoft, Meta and Apple Are Part of Zacks Earnings Preview – The Globe and Mail” https://www.theglobeandmail.com/investing/markets/stocks/AAPL/pressreleases/1536758/amazon-alphabet-microsoft-meta-and-apple-are-part-of-zacks-earnings-preview/ Accessed 18 June 2026
- “Big Tech Earnings Shifted the AI Trade Toward Alphabet and Amazon – Analytics Insight” https://www.analyticsinsight.net/news/big-tech-earnings-shifted-the-ai-trade-toward-alphabet-and-amazon Accessed 18 June 2026
- “Magnificent Seven’s Stock Market Dominance Shows Signs of Cracking – Fortune” https://fortune.com/2026/01/11/magnificent-7-stock-market-dominance-cracking-nvidia-microsoft-apple-meta-alphabet-amazon-tesla/ Accessed 18 June 2026
- “World Economic Outlook April 2026: Global Economy in the Shadow of War – International Monetary Fund” https://www.imf.org/en/publications/weo/issues/2026/04/14/world-economic-outlook-april-2026 Accessed 18 June 2026
- “World Economic Outlook Update January 2026 – International Monetary Fund” https://www.imf.org/en/publications/weo/issues/2026/01/19/world-economic-outlook-update-january-2026 Accessed 18 June 2026
- “How Rising Geopolitical Risks Weigh on Asset Prices – IMF Blog” https://www.imf.org/en/Blogs/Articles/2025/04/14/how-rising-geopolitical-risks-weigh-on-asset-prices Accessed 18 June 2026
- “SpaceX IPO Takeaways: SPCX Closes at $161, Jumping 19% After Record Debut – CNBC” https://www.cnbc.com/2026/06/12/spacex-ipo-spcx-live-updates.html Accessed 18 June 2026
- “SpaceX Stock SPCX: How to Buy After the IPO – Financer” https://financer.com/invest/spacex-ipo/ Accessed 18 June 2026
- “SpaceX Files IPO Prospectus, Offering a Peek Into Its Finances – Yahoo Finance” https://finance.yahoo.com/markets/article/spacex-files-ipo-prospectus-offering-a-peek-into-its-finances-205406189.html Accessed 18 June 2026
- “SpaceX Is Heavily Reliant on Starlink for Growth and Profit – CNBC” https://www.cnbc.com/2026/05/21/spacex-starlink-growth-profit-nasdaq-ipo.html Accessed 18 June 2026