CFDs are a widely popular trading instrument for many reasons. You can trade on leverage for greater capital efficiency, access a wide range of markets and assets to diversify your portfolio, and open both long and short positions to trade all market conditions.
Additionally, CFDs can be traded with different types of trading strategies, allowing you to adapt to the characteristics of the underlying asset or market. In this article, we’ll discuss some basic CFD trading strategies, as well as tips to avoid common mistakes.
Basic CFD trading strategies
Below are a few basic CFD trading strategies to help you get started:
1. Trend following
Trend following is a trading strategy in which “the trend is your friend”. This means a trader may choose to trade along with a price trend; if the trend continue, there may be potential for gains, though losses can also occur.
Crucially, trend following requires traders to wait till a trend has been established before taking a position. This often means having to give up on the first part of a price trend, instead of jumping immediately when you think a price trend is starting.
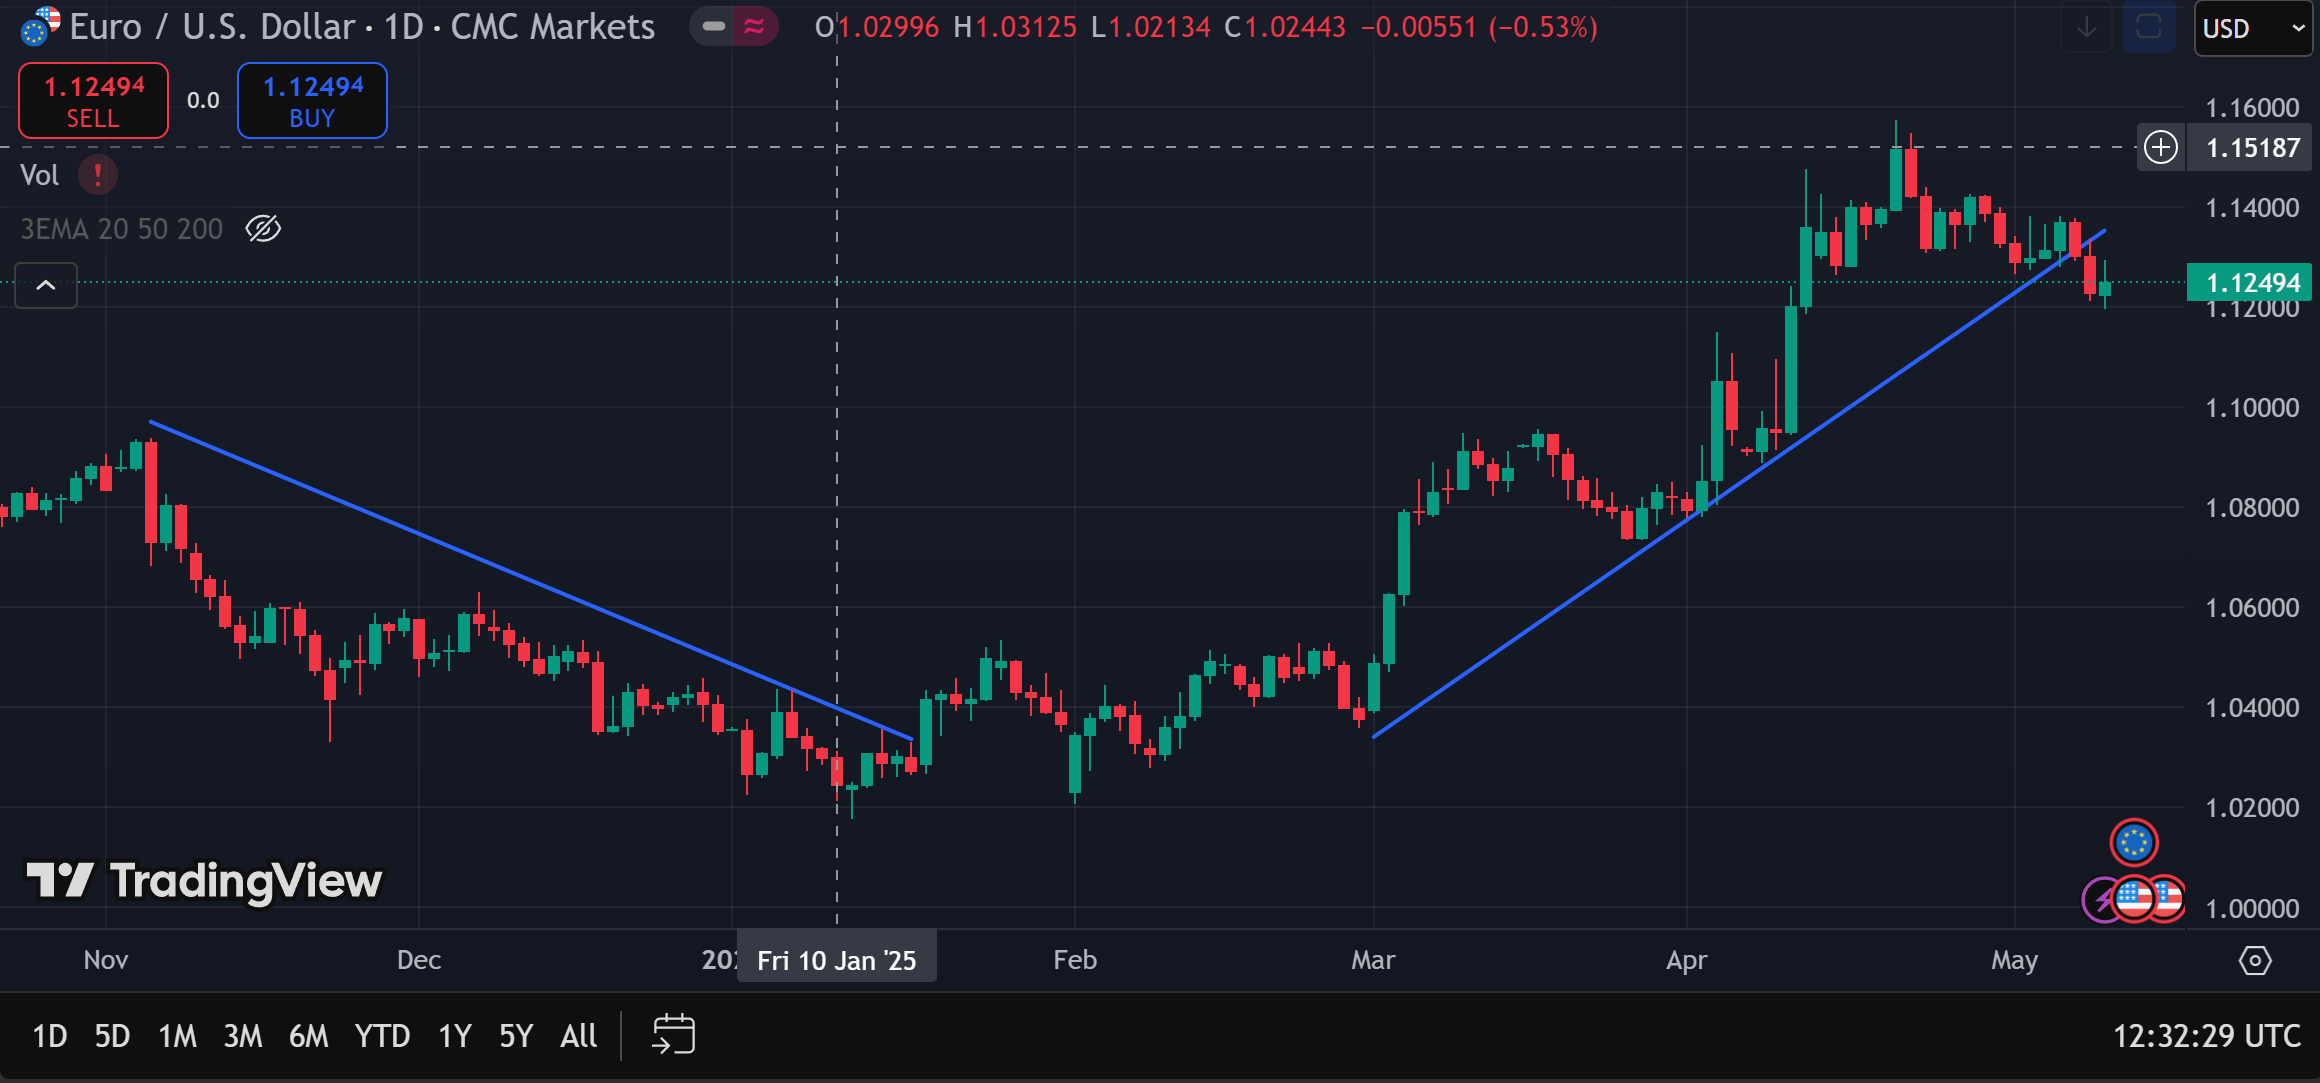
Consider the image above, which shows the price chart of EUR/USD over the past 12 months.
Between Nov 2024 to Jan 2025, we can see the currency pair is in a clear downtrend. A trend following trader would place a short trade to sell the pair, maintaining the trade until there are signs of a trend reversal.
After a period of consolidation, EUR/USD spiked upwards sharply entering Mar. Although there was a brief reversal towards Apr, the currency pair recovered and went on to chart a strong uptrend until May.
To take advantage of this uptrend, a trend following trader may only wait until April before taking a long position. This is a more cautious application of the strategy, with the trader waiting for clear confirmation of the uptrend – shown by higher highs and the two long green candles in the first half of the month – before committing.
Another potential play here is to take a long position after spotting the three long green candles in the beginning of March. However, this trade would likely be short-lived, as the uptrend was subsequently weakened soon after, potentially triggering a stop.
2. Breakout trading
In breakout trading strategy, a trader looks for price breakouts – events where the price of an asset breaks out of a previously established trend. The stronger the breakout, the more momentum the resulting trend is likely to have.
Once a breakout is identified, the trader opens a trade taking the relevant position, going long if the price breaks to the upside. Conversely, if the price breaks to the downside, the trader would go short to sell the asset.
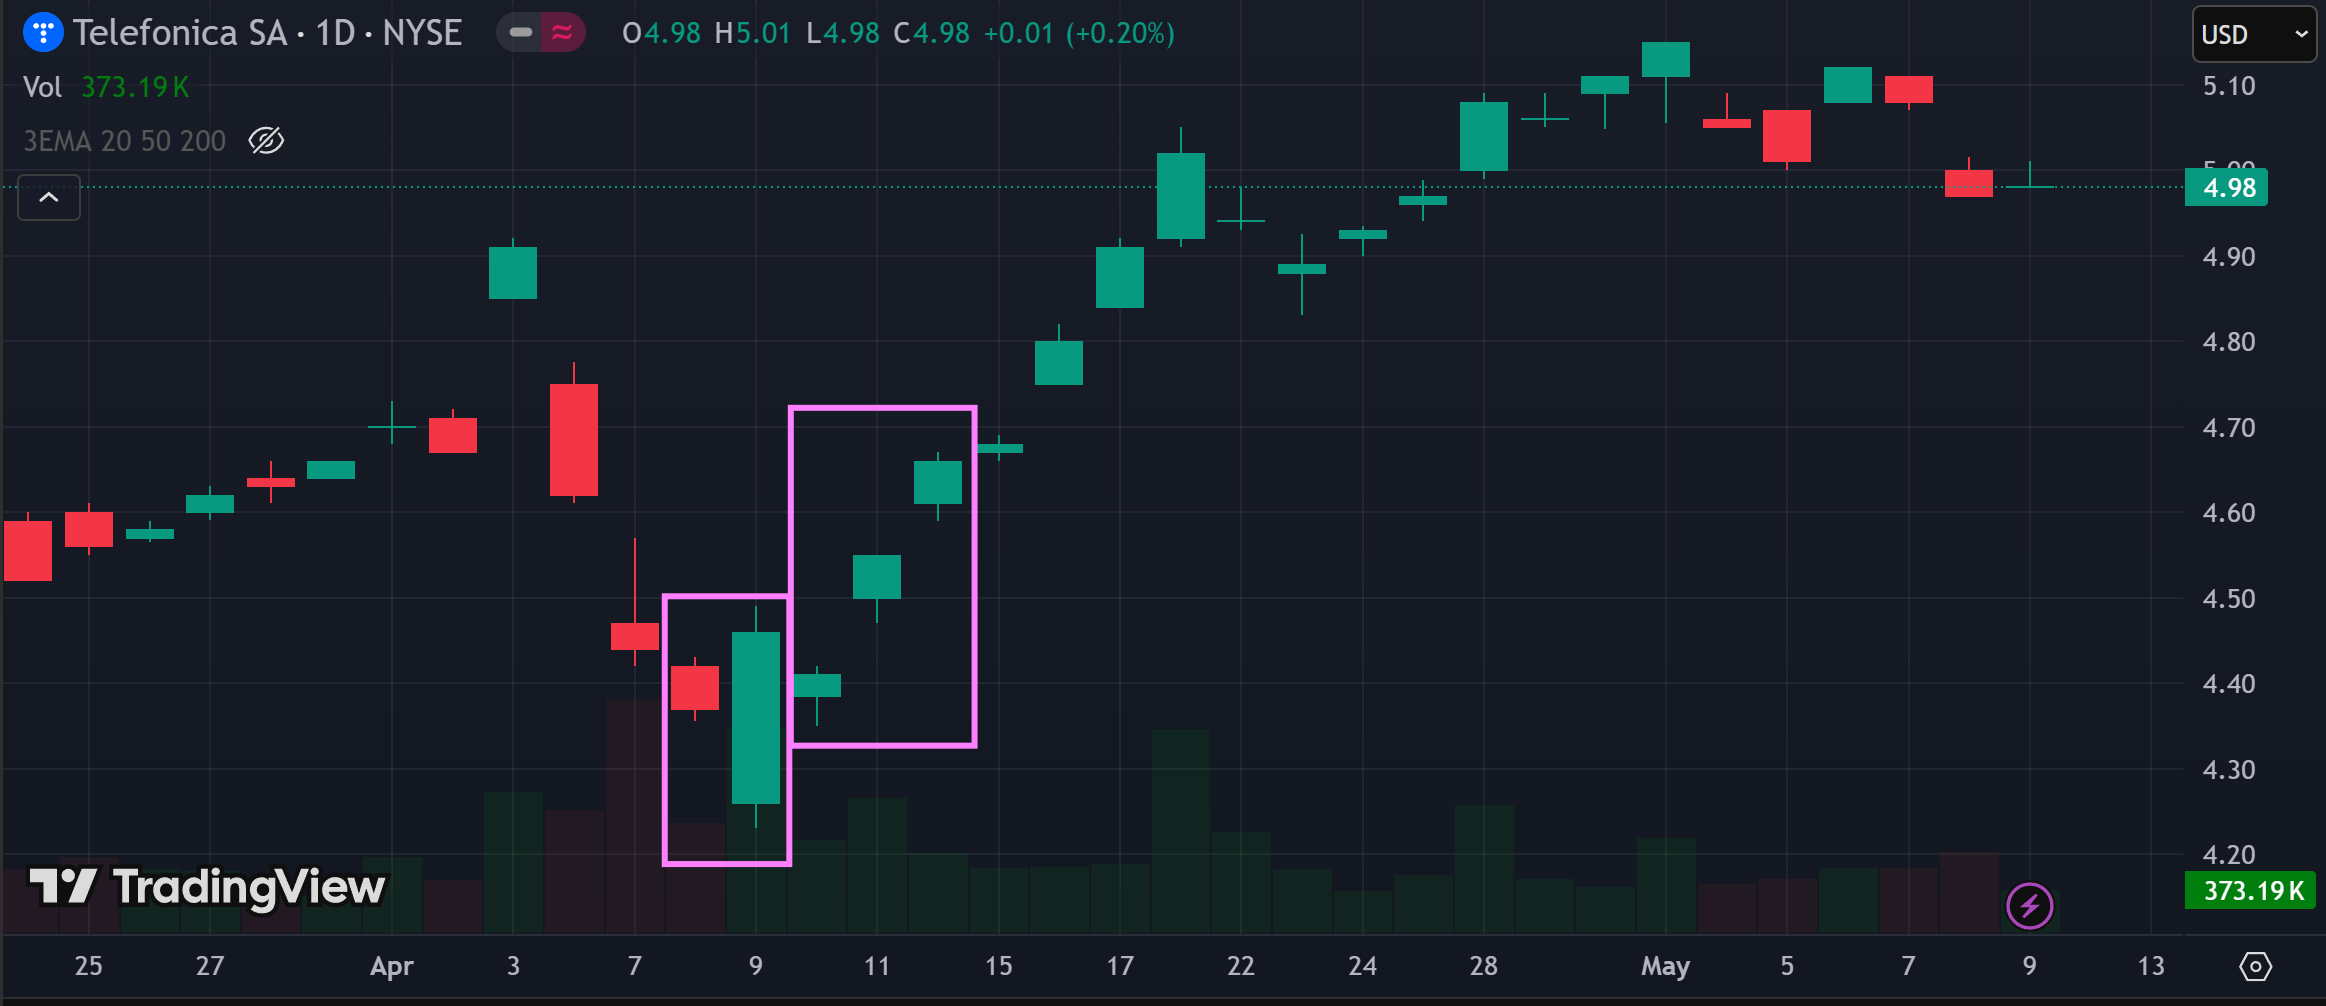
The chart above shows the price of Telefonica stock in Apr and May. Notice the clear uptrend which started from 9 Apr and lasted all the way until 1 May.
Pay attention to the pink boxes on the chart. The first pink box highlights the signal that a trader following the breakout strategy would look out for. These two candlesticks form what’s known as a “bullish engulfing” candlestick pattern, which is among the most favourable signals of a coming bull trend.
Furthermore, the uptrend was strongly confirmed by another bullish candlestick pattern known as “three white/green soldiers”, highlighted in the second pink box. The series of escalating green candlesticks indicate strong buying momentum, strengthening the resulting price trend.
Having identified the breakout, a breakout trader might go long to ride the uptrend, maintaining the position until there are signs the uptrend is breaking down (as indicated by the red candles towards the right side of the price chart). At this point, the trader might close the long position to realise any potential gains.
3. Range trading
It is not uncommon for certain markets to trade sideways, where prices bounce up and down between a high point and a low point for a prolonged duration without breaking through. This is known as a range-bound market, presenting an opportunity to deploy a range trading strategy.
Accordingly, a range trading strategy focuses on placing trades when the price approaches established support and resistance levels, and riding the resulting trend as the price reverses.
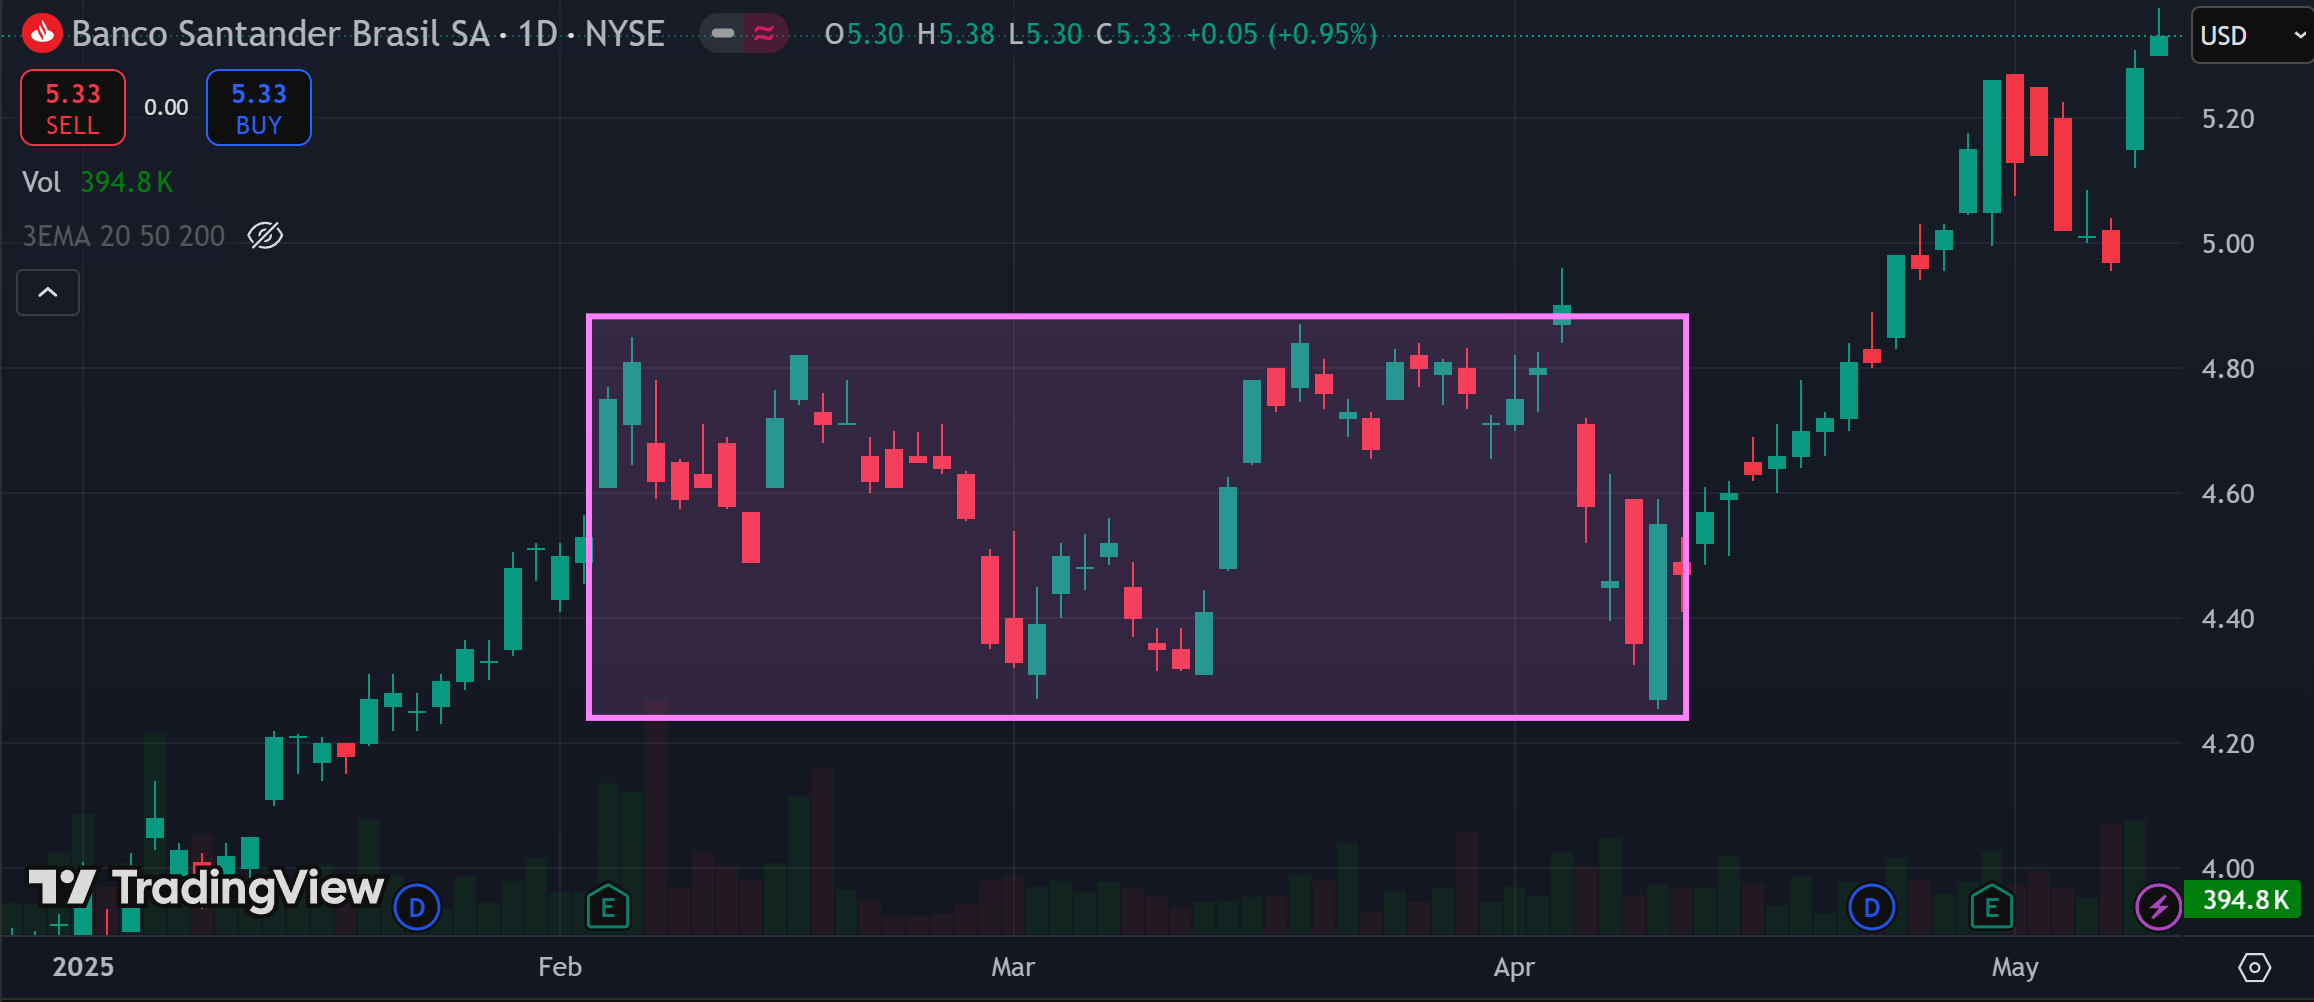
The screenshot above shows the price chart of Banco Santander (BSAC). The area highlighted by the pink box shows the stock exhibiting range-bound behaviour, which lasted from Feb to mid-Apr. This means there was a period of about 10 weeks in which a trader might have had success with range trading.
During this period, the price of BSAC traded between a floor of US$4.20 and a ceiling of US$ 4.90. Following the range trading strategy, a trader might enter a trade, going long when the price approaches the floor, and ride the trade up until a reversal occurs.
By the same token, a range trader might open a trade to go short when the price approaches the ceiling, riding the downtrend until signs of a price reversal manifests.
Technical analysis for beginners
Technical analysis revolves around reading a price chart and interpreting the patterns formed within. The purpose is to help a trader formulate trading ideas, find trading opportunities, and improve their trading decisions.
To the uninitiated, technical analysis may seem like drawing random lines and then making “predictions” based on them. In fact, technical indicators – charting tools used in the practice – are mathematically formulated based on historic market data such as price and volume, involving moving averages, market momentum measurements, and even the renowned Fibonacci sequence.
Modern day trading platforms come with several technical indicators included, allowing you to plot them on your price chart with a few clicks or taps. In most cases, you can use the technical indicators with the default parameters, but you can also tweak them to better fit your preferences if you wish. Identifying entry and exit points
To be successful, a trader should aim to identify suitable entry and exit points.
An entry point is the point at which you will open a trade. You will buy to go long if you believe the price will go up, or sell to go short if you believe the price will go down.
Meanwhile, the exit point is the point at which you close your trade. You do so by entering the opposite order: a Sell if you opened with a Buy, and vice versa.
There are many technical indicators that traders often use to identify potential entry and exit points, which we will discuss next.
Popular technical indicators
Support and resistance levels
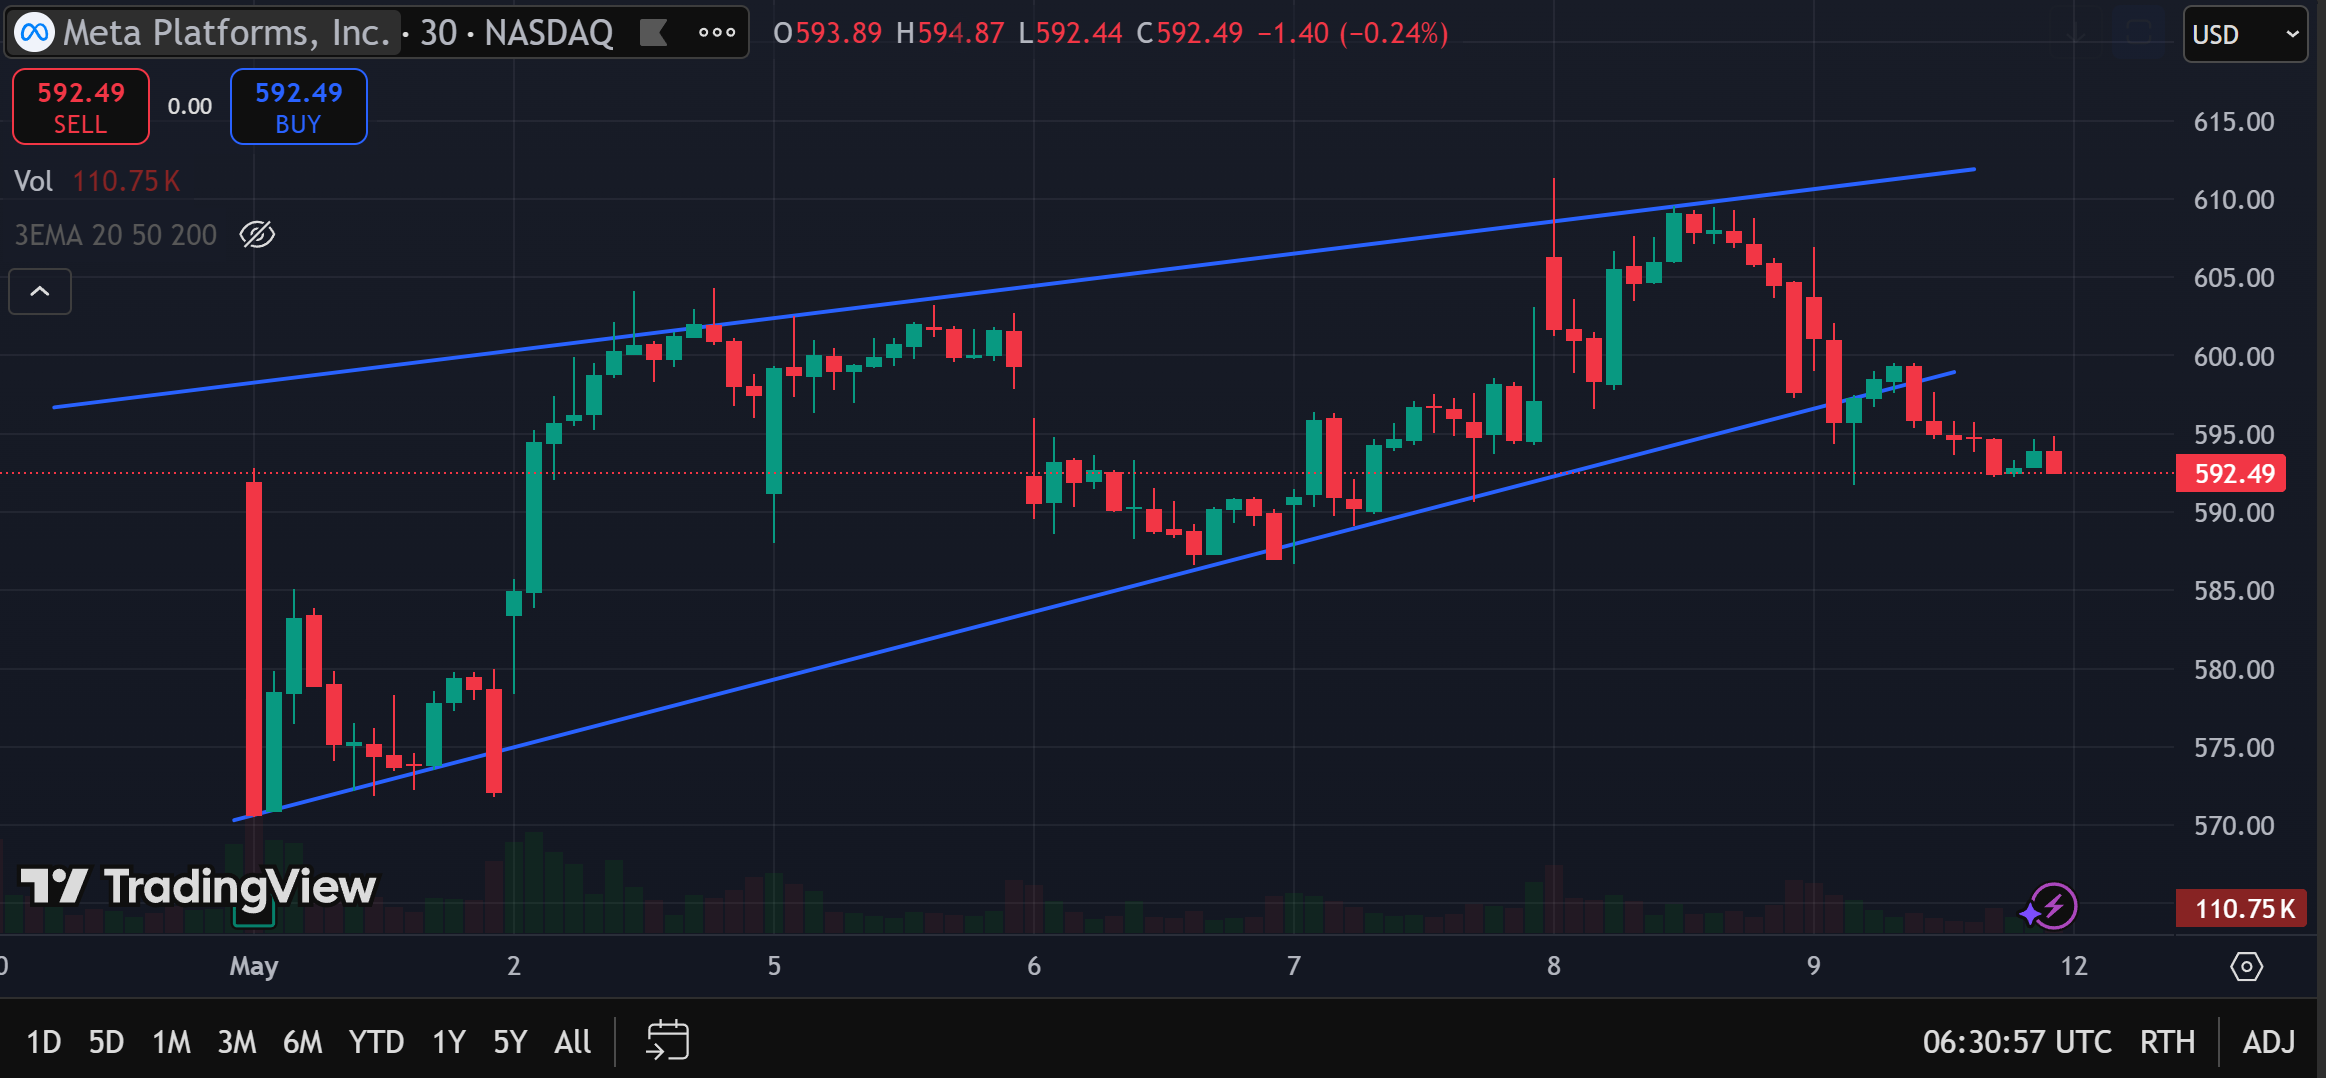
The image above shows the candlestick chart of META stock’s price performance in May 2025. The two blue lines at the top and bottom show where the resistance and support levels are, respectively.
The resistance level indicates the highest price the market has historically been willing to pay for the asset. At resistance, buying pressure fails to overcome selling pressure, causing the price of the asset to reverse course. However, if demand surges, the price could break through resistance and go on to chart a new uptrend.
In the case of META, this did not happen; in fact, the opposite did. Just as the resistance level represents a price ceiling, the support level charts a price floor – where demand for the asset is strongest.
Finding entry/exit points
As you can see, between 9 and 12 May, the price of META broke through support twice. This could signal that the bulls might be losing control; it could also indicated a potential entry point to consider a short position, or an exit point to close a long position,
True enough, after the second red candle the price of META fell, causing the stock to chart a new downtrend.
Ok, but what about May 2, when a long red candle broke through the support level? Well, support was breached only once, marking it as a false breakout. META stock went on to make a huge jump up immediately after, and if a short position had been opened, it could have resulted in a significant loss.
In general, the more times a price tests (bounces off) a support or resistance level, the stronger the breakout signal may be. Hence, it’s generally considered good practice to wait until there have been two or three bounces before calling a price breakout.
Moving averages
Moving averages are a mathematical calculation used to show the average price of an asset over a stipulated time period. As a technical indicator, moving averages help to filter out market noise, smoothen price trend lines, and show the underlying direction of a price trend.
There are two types of moving averages – simple and exponential. In the former, all prices in the range are given equal weight. In the latter, prices that are more recent are given higher weighting, this allows an exponential moving average (EMA) to be more sensitive to price changes.
Finding entry/exit points
By pairing a shorter duration moving average with a longer duration moving average, traders may spot potential entry and exit points.
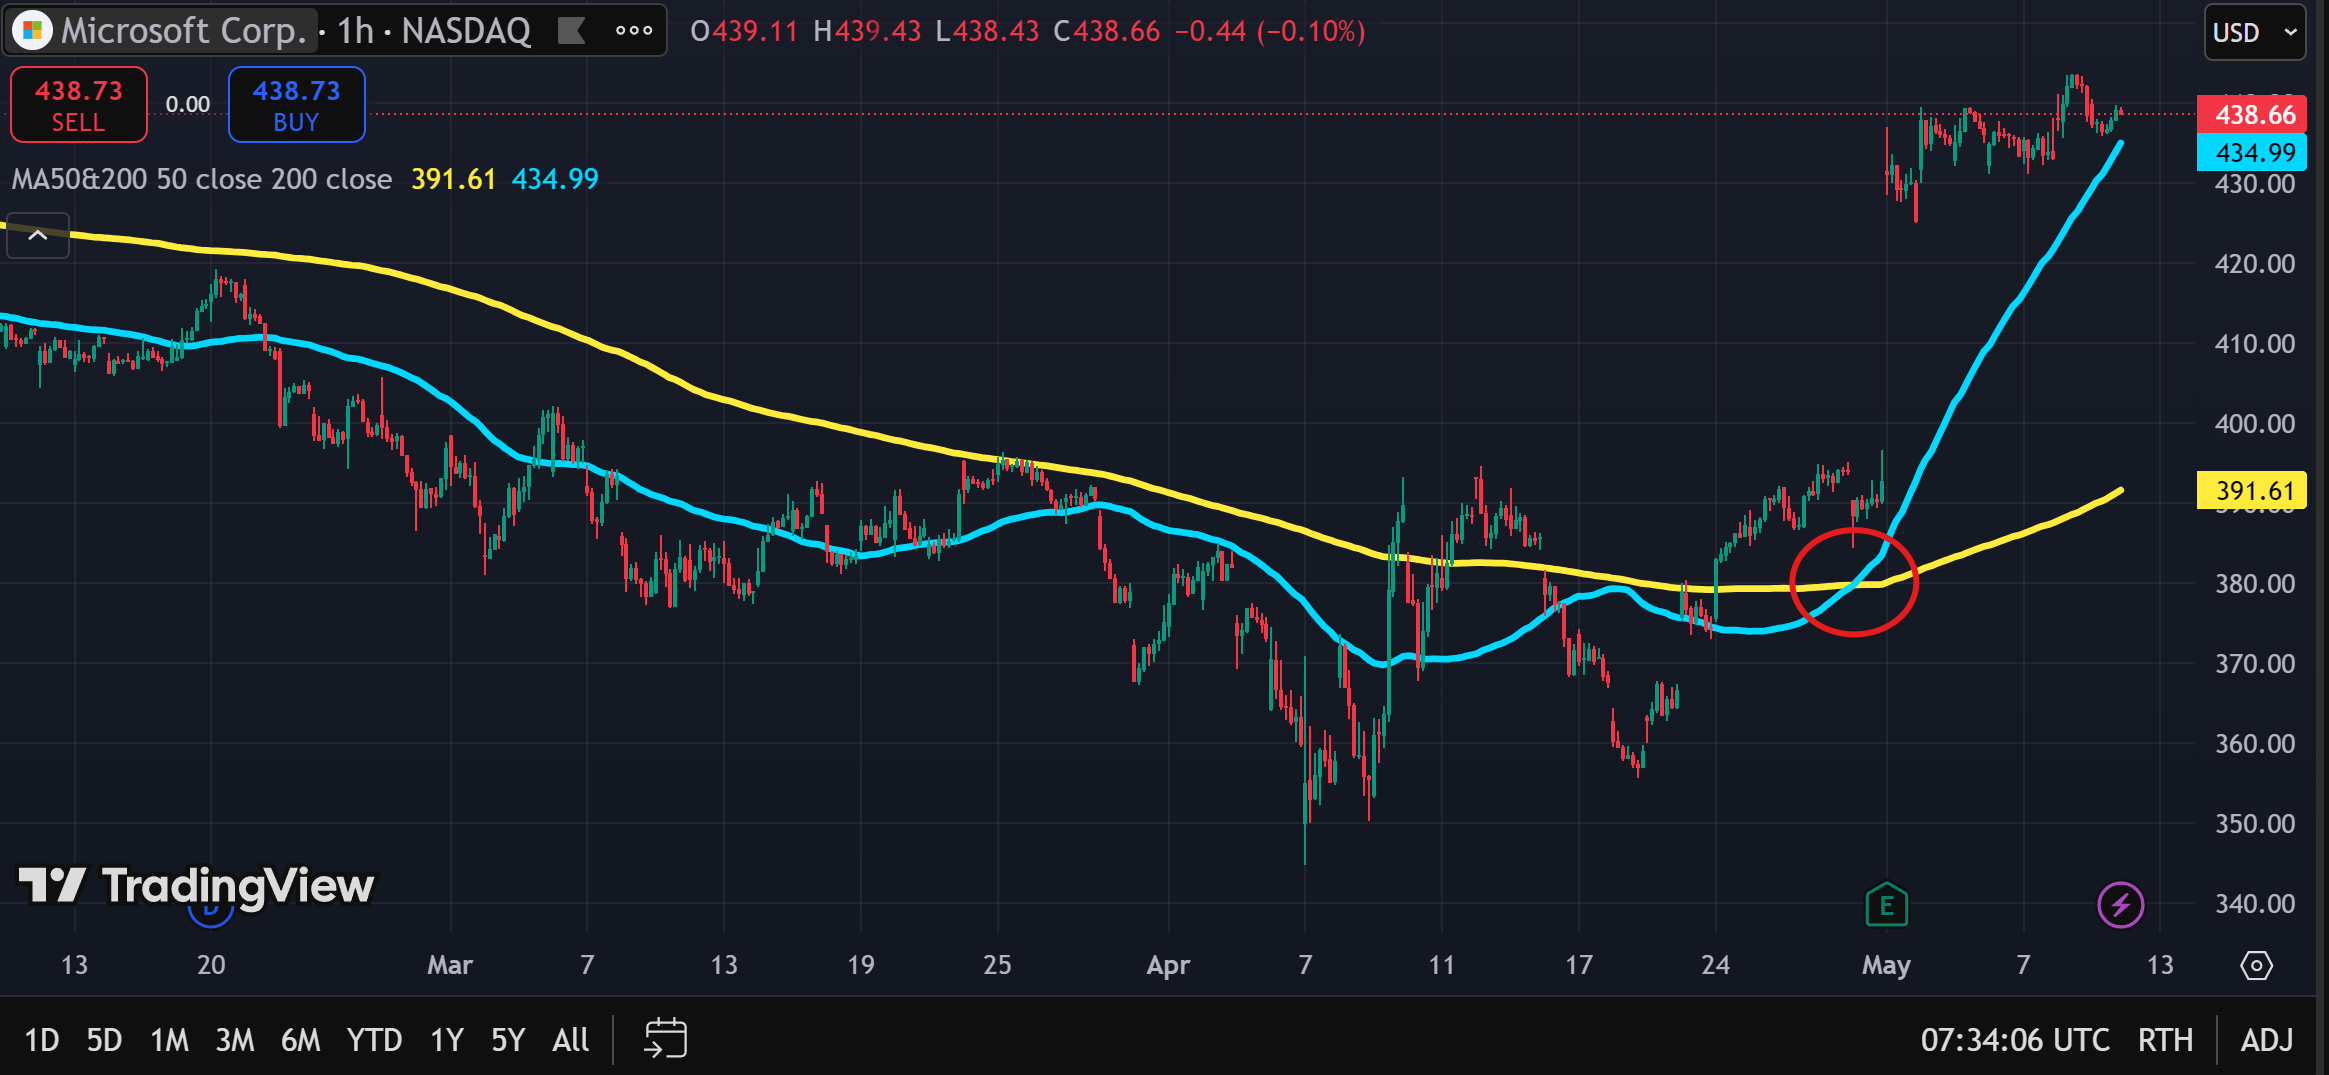
The screenshot above shows the price action of Microsoft (MSFT) from Mar to May 2025. After better-than-expected Q2 earnings, the price of the stock spiked upwards, as seen in the right side of the image.
The blue line is the 50-Day EMA, while the yellow line shows the 200-Day EMA. Notice how in Mar and Apr the 50-Day EMA remained under the 200-Day EMA? This is typical when the market is bearish, keeping the price in a downtrend.
However, at the beginning of May, the 50-Day EMA crossed above the 200-Day EMA (circled in red). This was a strongly bullish signal (aka known as a Golden Cross) indicating a price breakout was imminent.
The appearance of the Golden Cross could be interpreted as an entry point to go long on MSFT, or conversely, to exit a short position.
Relative Strength Index (RSI)
Another popular technical indicator that can show potential trade entry and exit points is the Relative Strength Index (RSI). This is a type of indicator known as an oscillator, and provides a reading from 0 to 100.
The RSI compares the strength of recent price gains versus recent price losses, measuring the speed and magnitude of recent price changes and helping to identify potential overbought and oversold conditions.
When the RSI is at 30 or below, the asset is considered oversold, indicating a potential buying opportunity. When the RSI is 70 and above, the asset is considered overbought. This could be viewed as a signal to consider selling the asset.
Finding entry/exit points
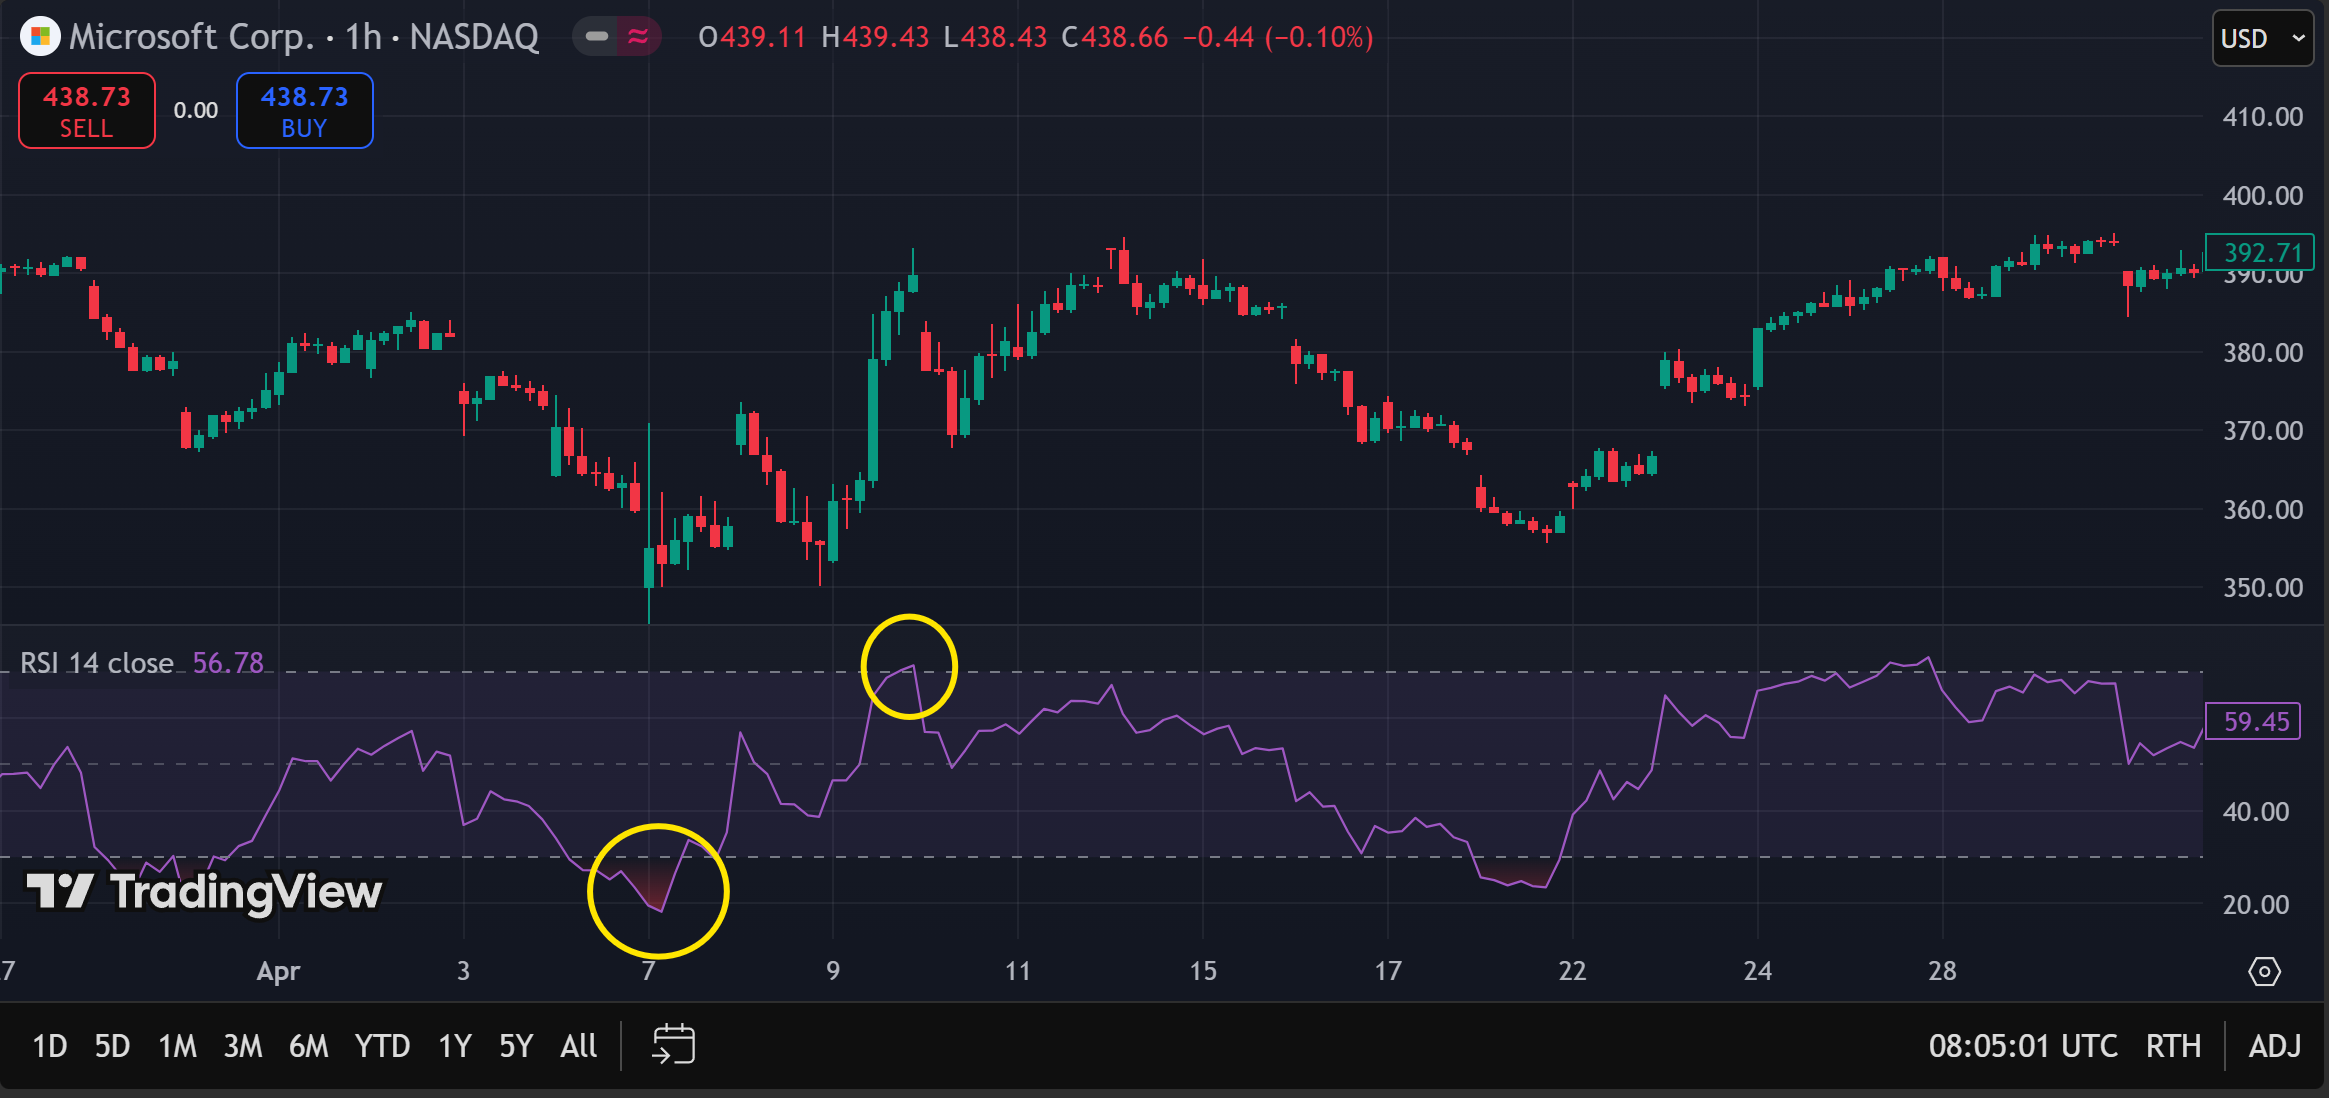
The screenshot here shows the same MSFT price chart, but zoomed in to a section just before the stock’s price spike happened. The RSI has also been added to the bottom of the chart.
Notice the two areas of the RSI circled in yellow. In the first one, the RSI fell below the band, suggesting that MSFT was oversold. This could be considered an entry point, offering an opportunity to open a long position on the stock.
The trade could be held open until the RSI breached the upper limit of the band (second yellow circle), suggesting the stock was now entering an overbought state. This could be seen as an indication to exit the long position and take profit.
Fundamental analysis basics
Financial markets are sensitive to geopolitical and macroeconomic conditions. Traders should strive to keep up with announcements and developments that could impact their trades and usher in unexpected trading opportunities.
Here are some key economic indicators to know, and how they could potentially impact the market,
- Corporate earnings: Earnings are released once every quarter, and usually come with increased volatility in the stock markets. Better-than-expected performance typically spur price rallies, creating potential buying opportunities. In contrast, earnings that missed expectations will usually see a stock sell-off, creating opportunities to short the stock.
- Interest rates: When central banks raise interest rates, this makes debt more expensive, and capital more difficult to raise. This forces companies to cut back on expansion plans, which dampens earnings outlook. In turn, investors may decide to sell their holdings preemptively to cut their losses. Conversely, when central banks lower interest rates, debt becomes cheaper and capital more readily available. This tends to spur demand for stocks, causing prices to go up.
- Inflation: High inflation levels tend to prompt central banks to increase interest rates, which can bring about the same effects as discussed in the previous pointer.
- Household consumption levels: Household consumption is a core driver of many commodities, such as flour, sugar, coffee, meat and other agricultural produce, or coal and gas for heating. Slowing consumption can lead to lower demand for commodities, which will impact prices.
- Trade tariffs: The announcement of tariffs on imported goods can shake up the market, as Trump’s administration clearly demonstrated in early 2025. This is because trade tariffs raise costs for companies, reducing profitability and harming shareholder interests. Be on the lookout for trade deals or tariff agreements that could create trading opportunities in your chosen markets.
Stay updated on market news and important dates with Vantage’s economic calender. With this handy tool, you can easily keep track of significant economic events, data releases, and announcements that can impact financial markets and economies.
You’ll find key dates for economic indicators such as unemployment rates, GDP growth, inflation rates, and central bank interest rate decisions – all the information you need to assess overall trends and potential trading opportunities.
Risk management in CFD trading
CFDs can be potentially very powerful, but they need to be treated with the right approach. Bear in mind that CFDs are leveraged instruments, which means profits are amplified – but so are losses, potentially to a degree exceeding your account balance.
Furthermore, certain markets are highly volatile by nature; combined with the fast pace of typical trades, CFD trading is considered more risky, and tends to be more suited to experienced traders. No matter if you’re a veteran or a beginner, it is essential to learn proper risk management and implement them in CFD trading.
Stop loss and take profit orders
Stop loss orders and take profit orders are two widely-used risk management tools popular among CFD traders. They are digital tools that enable you to automate the buying and selling of assets at predetermined prices.
When used correctly, stop loss and take profit orders can potentially help you:
- Conserve time by automating trade exits, reducing the need for constant market monitoring.
- Maintain control by predefining exit points, ensuring trades are closed based on strategic decisions rather than emotional responses.
- Promote consistency and discipline by reinforcing adherence to a planned trading approach, helping to avoid reactive or high-risk behaviour.
- Mitigate potential losses and secure gains by facilitating timely exits aligned with market movements.
- Minimise uncertainty and safeguard capital, contributing to a more stable and controlled trading environment.
What are stop loss orders?
A stop loss order is an automated instruction for your broker to close your position when a certain price point has been reached. This is useful for when the market moves against your position, limiting your losses and preventing you from holding on to a losing position in the hopes of a reversal.
Stop loss orders can be set when placing your trade. You can choose the price level at which the stop-loss triggers. If the stop loss price is reached or exceeded, the order is executed and your broker attempts to immediately close your trade.
Note that stop loss orders do not guarantee your maximum loss will be capped at the price level you set. If the market gaps overnight, or makes large moves unexpectedly, the asset price might exceed your stop loss price before the stop loss order kicks in. This would result in a larger loss than expected.
What are take profit orders?
Take profit orders can be helpful for locking in potential profits. They are automated instructions that come into effect when your target price is reached. This saves you the trouble of having to watch the market constantly for your target price. More importantly, take profit orders stops you from keeping a winning trade open longer than necessary. This can reduce the risk of the market turning against you, which could result in losing some or all of your profits.
Like with stop loss orders, you can set take profit orders when entering your trade. However, note that your take profit will trigger once the target price has been reached – even if the market further moves in your favour. This means that setting take profits that are too narrow can potentially mean missing out on a portion of your profits in a winning trade.
Risk/reward ratio and win rate
Another important factor to consider in managing risk when trading CFDs include choosing a realistic risk/reward ratio.
The risk/reward ratio may be understood as:
- Amount of capital risked vs Amount of potential profit
For example, if you risk S$100 to potentially profit $300, your risk/reward ratio is 1:3. If you risk $50 to potentially profit $100, your risk/reward ratio is 1:2.
When selecting your risk/reward ratio, it’s important to consider the context of win rate, which is defined as:
- No. of winning trades divided by total no. of trades multiplied by 100
Knowing the win rate of a strategy can be useful, because win rate and risk/reward ratio work hand in hand. Here’s the kicker – a high win rate may sound impressive, but may not necessarily give you better results.
In fact, a high win rate with a low risk/reward ratio may be outperformed by a low win rate with a high risk/reward ratio. Here’s why:
- A higher risk/reward ratio provides higher profits per win.
- This means fewer wins are needed to break even/reach profitability.
- In turn, this means that with a high-enough risk/reward ratio, even a low win rate strategy can shine.
Having said that, it is still important to be realistic when choosing the risk/reward ratio. For instance, a risk/reward ratio of 1:10 would mean 5x more market volatility than a risk/reward of 1:2.
Setting an ideal position size
Another core tenant of CFD risk management is determining the right position size.
Position size refers to how much of your trading budget is placed at risk per trade. a position size that is too large risks wiping out your trading account balance in a few bad trades, while one that is too small fails to capitalise fully on a winning trade.
The key is considering your position size using one of these methods:
- Setting a fixed amount per trade. Which may need to revise this amount as your trading budget changes.
- Setting a percentage – typically between 1% to 5% of your trading budget. Those with larger trading balances might use a smaller percentage.
Because CFDs are commonly traded using leverage, it is important to calculate your position size using the total position controlled, and not just your margin. For example, if you use 10:1 leverage, and open a trade with $1,000, your position size is 10 x $1,000 = $10,000.
Managing market volatility
Let’s consider a hypothetical example to demonstrate how one might approach CFD trading.
Assuming you want to trade CFDs on ABC Inc, a newly listed company specialising in home medical kits.
Here’s an example setup:
ABC is trading at $10 per share
- Expectation: price will go up to $15 per share
- Stop loss: $8 (loss of $2 per share)
- Take profit $15 (profit of $5 per share)
- Total trading budget: $20,000
- Position size (maximum amount to risk for this trade): $200 (1% of $20,000)
- No. of shares to buy: 100 ($200 divided by max loss of $2 per share)
- Total cost of trade: $1,000 (100 shares x $10 each)
- Leverage: 1:20
- Initial deposit: $50
- Total position = 100 shares
| With leverage ($50 = 100 shares) | Without leverage ($1,000 = 100 shares) | |
| Trade goes in your favour | If ABC rises to $15 Take profit triggers at $15 Profit per share: $5 Total profit: $5 x 100 shares = $500 Return on $50 deposit = 1,000% | If ABC rises to $15 Take profit triggers at $15 Profit per share: $5 Total profit: $5 x 100 shares = $500 Return on $1,000 deposit = 50% |
| Trade goes against you | If ABC falls to $8 Stop loss triggers at $8 Loss per share: $2 Total loss: $2 x 100 shares = $200 Loss on $50 deposit = 400% | If ABC falls to $8 Stop loss triggers at $8 Loss per share: $2 Total loss: $2 x 100 shares = $200 Loss on $1,000 deposit = 20% |
As you’d have noticed, the use of leverage amplifies both profits and losses. Thus, when calculating position size, it’s important to take leverage into account.
In our example, the position size – or the maximum amount we’re willing to lose in this trade – is 1% of $20,000, or $200. We set a stop loss of $8, which means a maximum loss of $2 per share.
In order to cap maximum loss for the trade at $200, we should only purchase $200/$2 = 100 shares. As each share costs $10, our total deposit for the trade would be 100 x $10 = $1,000.
However, because we used 1:20 leverage, we need only put down $1,000 divided by 20 = $50. This allows us to control 100 shares.
If the price goes up to $15 per share, triggering our take profit, we make a profit of $500 on initial deposit of $50, or 10x. That’s pretty good.
But, should the price drop the full $2 to our stop loss level, we actually lose a total of $200, which is 4x our initial deposit of $50.
In this case, the stop loss did its job, capping the maximum risk at $200 for this trade. But if the stock price plunged overnight (due to unexpected trade tariffs, for instance) and the stock opened trading at $7 per share, our stop loss would be triggered at $7, causing a total loss of $300, exceeding our position size of 1%.
To manage risks effectively in CFD trading, traders can make use of Vantage’s suite of risk management tools and alerts. This will allow you to take better control of your trades, so you can intervene when the need arises.
Common mistakes beginners should avoid
CFD trading can be highly exciting, but beginners would do well to maintain a calm and disciplined approach. In fact, one of the most common mistakes beginner traders make is to chase trades without considering how much risk you are exposing yourself to in the process.
This is known as overtrading, which is when you keep a trade open far longer than you should, in the belief that you can reap a larger profit, or narrow your losses. Always remember that the markets are inherently unpredictable, and overtrading rarely gives you the results you hope for.
Overtrading is often driven by negative emotions, such as greed for higher returns or aversion to taking losses. Hence, it is important to recognise when your actions and decisions are being driven by emotions, and then take steps to cease your irrational behaviour.
Tips for sustainable CFD trading
- Take regular breaks. Walk away from trading at regular intervals to give yourself a chance to reset.
- Be mindful. Approach trading purposefully, and make it a regularly scheduled activity in your life. Give trading the attention it deserves, instead of trading whenever you feel like it.
- Study the markets. Before entering a trade, study as much as you can about the underlying asset or market. Where do you think the price is headed, and why? If you cannot justify or explain your rationale, that’s a sign of insufficient understanding of the market you are attempting to trade
- Start a journal. Trading requires discipline, planning and constant reflecting on your own trading outcomes. Keeping a trading journal will prove helpful; use it regularly to plan your trades, keep notes, write down trading ideas, and record your results. As you grow in skill, keep updating your trading journal with your learnings.
Conclusion
Truth be told, CFD trading demands hard work and discipline to succeed. Not only must you know the markets and the tools available to you, you must also know yourself – what are your triggers, how can you stay in control, what are your preferred trading style, strategies and markets.
But for those who persist in setting up a solid foundation, CFD trading can be one of the most powerful tools in an investor’s arsenal, providing traders with flexibility, capital efficiency, and unfettered access to the price action of myriad markets, including bonds, stocks, ETFs, commodities, forex and more.
Start your investing journey with a partner you can count on. Vantage is an award-winning CFD broker built with your needs in mind, offering tight spreads, low fees and transparent pricing to keep your trading costs low. Enjoy the convenience of round-the-clock customer service, keep up with market developments via our news updates, and hone your skills with free educational resources. Sign up and start trading today!
RISK WARNING: CFDs are complex financial instruments and carry a high risk of losing money rapidly due to leverage. You should ensure you fully understand the risks involved and carefully consider whether you can afford to take the high risk of losing your money before trading.
Disclaimer: The information is provided for educational purposes only and doesn’t take into account your personal objectives, financial circumstances, or needs. It does not constitute investment advice. We encourage you to seek independent advice if necessary. The information has not been prepared in accordance with legal requirements designed to promote the independence of investment research. No representation or warranty is given as to the accuracy or completeness of any information contained within. This material may contain historical or past performance figures and should not be relied on. Furthermore estimates, forward-looking statements, and forecasts cannot be guaranteed. The information on this site and the products and services offered are not intended for distribution to any person in any country or jurisdiction where such distribution or use would be contrary to local law or regulation.