In Forex trading, there are two primary types of analysis commonly used by traders: technical and fundamental analysis. In this article, we explain the basics of technical analysis and how it can be used.
What is Technical Analysis?
The study of movements in the financial market is often referred to as technical analysis. More specifically, it refers to the study of historical price movements to determine future movements or prices of a financial instrument.
The concept of technical analysis has been around for hundreds of years, and the earliest form of technical analysis was adopted by Joseph de la Vega who used the skills to predict Dutch markets in 1683 [1].
Through the constant advancement of financial technology and tools created, the popularity of technical analysis continues to grow not just within forex markets but other asset classes as well.
Understanding Technical Analysis
In technical analysis, traders use either chart patterns, technical indicators, or even a combination of both to predict future trends. Experienced traders who rely heavily on technical analysis believe that everything traders need to know, is already reflected in the instrument’s price history.
Chart Patterns
The subjective form of technical analysis is called chart patterns.
Using chart patterns could help to determine where prices are headed, at least in theory. Such patterns can include:
- Candlestick Patterns
- Trendlines
- Fibonacci Retracements
- Supply & Demand
Technical Indicators
The statistical form of technical analysis is through technical indicators.
Technical indicators act as an interpreter of the markets and traders can use such information to their advantage. In total there are 3 major umbrellas of technical indicators: Trend, Oscillators, and Volume. For more advanced traders, custom technical indicators may also be adopted to help determine an instrument’s future price.
Using Technical Analysis
An instrument can be viewed through multiple timeframes. Technical analysis conducted on the higher timeframes holds more weight compared to ones conducted on the lower timeframes. As such, technical analysts often implement a top-down approach where technical analysis is conducted on the higher timeframes and sharpened as the timeframe narrows.
The top-down approach begins when a trader views the higher time frame to conduct technical analysis. The trader then scopes into a lower time frame to compare if the bias on the lower timeframes matches the bias on the higher timeframes.
Technical analysis conducted on the higher time frame gives a broad, longer-term view of the direction of the market while analysis on the lower time frame shows a short-term and detailed price movement.
Forex Technical Analysis Use Case
In this forex technical analysis use case, a forex trader focuses on the EUR/USD currency pair to begin trading at the beginning of March utilising a mix of indicators to guide trading decisions.
The trader uses the 50-day and 200-day moving averages to determine the overall trend, looking for moments when the shorter moving average crosses above the longer one to signal a bullish trend called the golden cross.
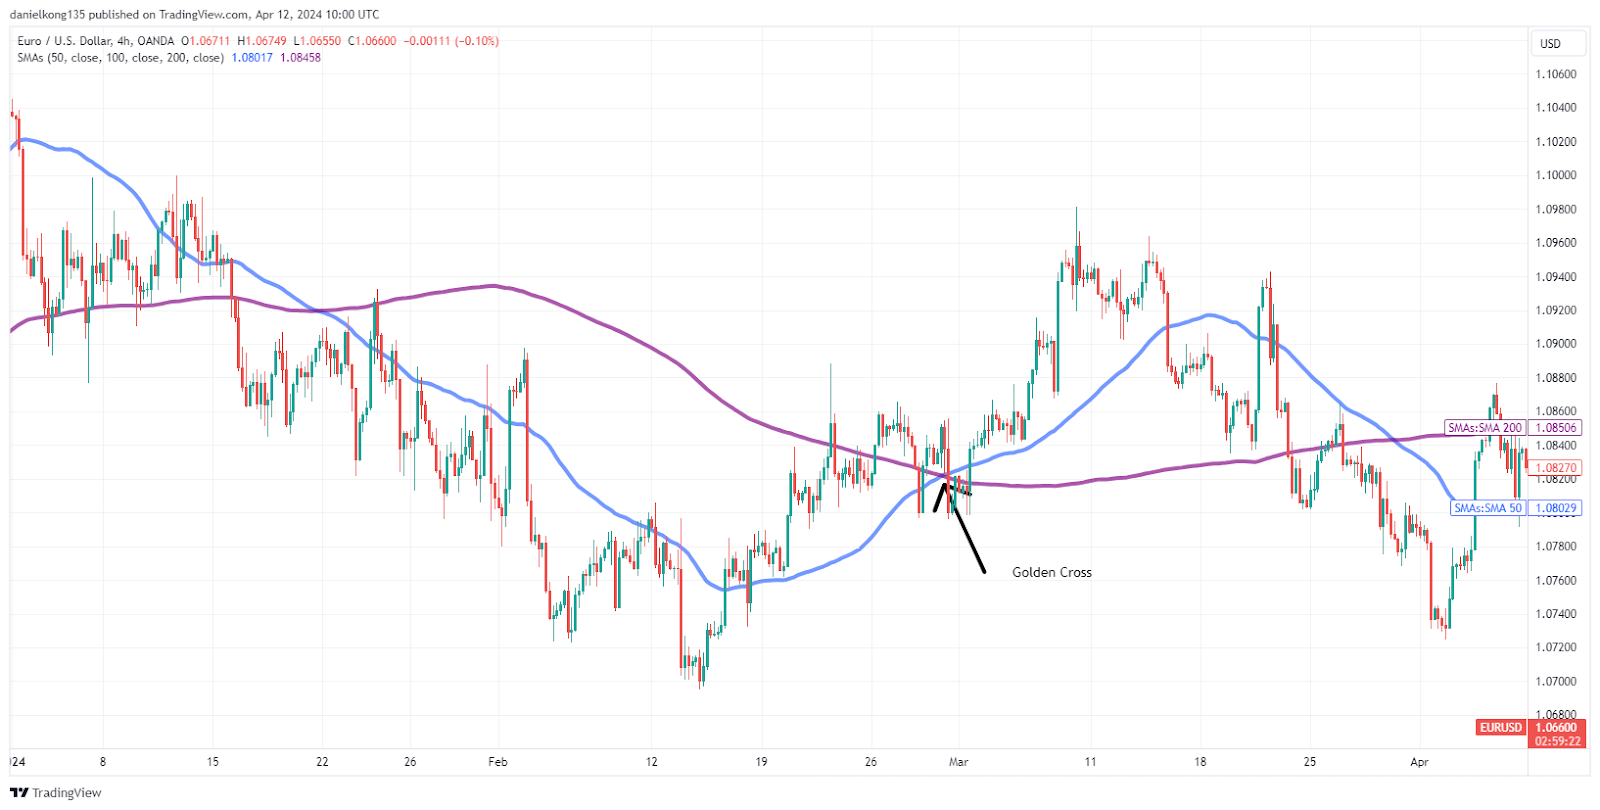
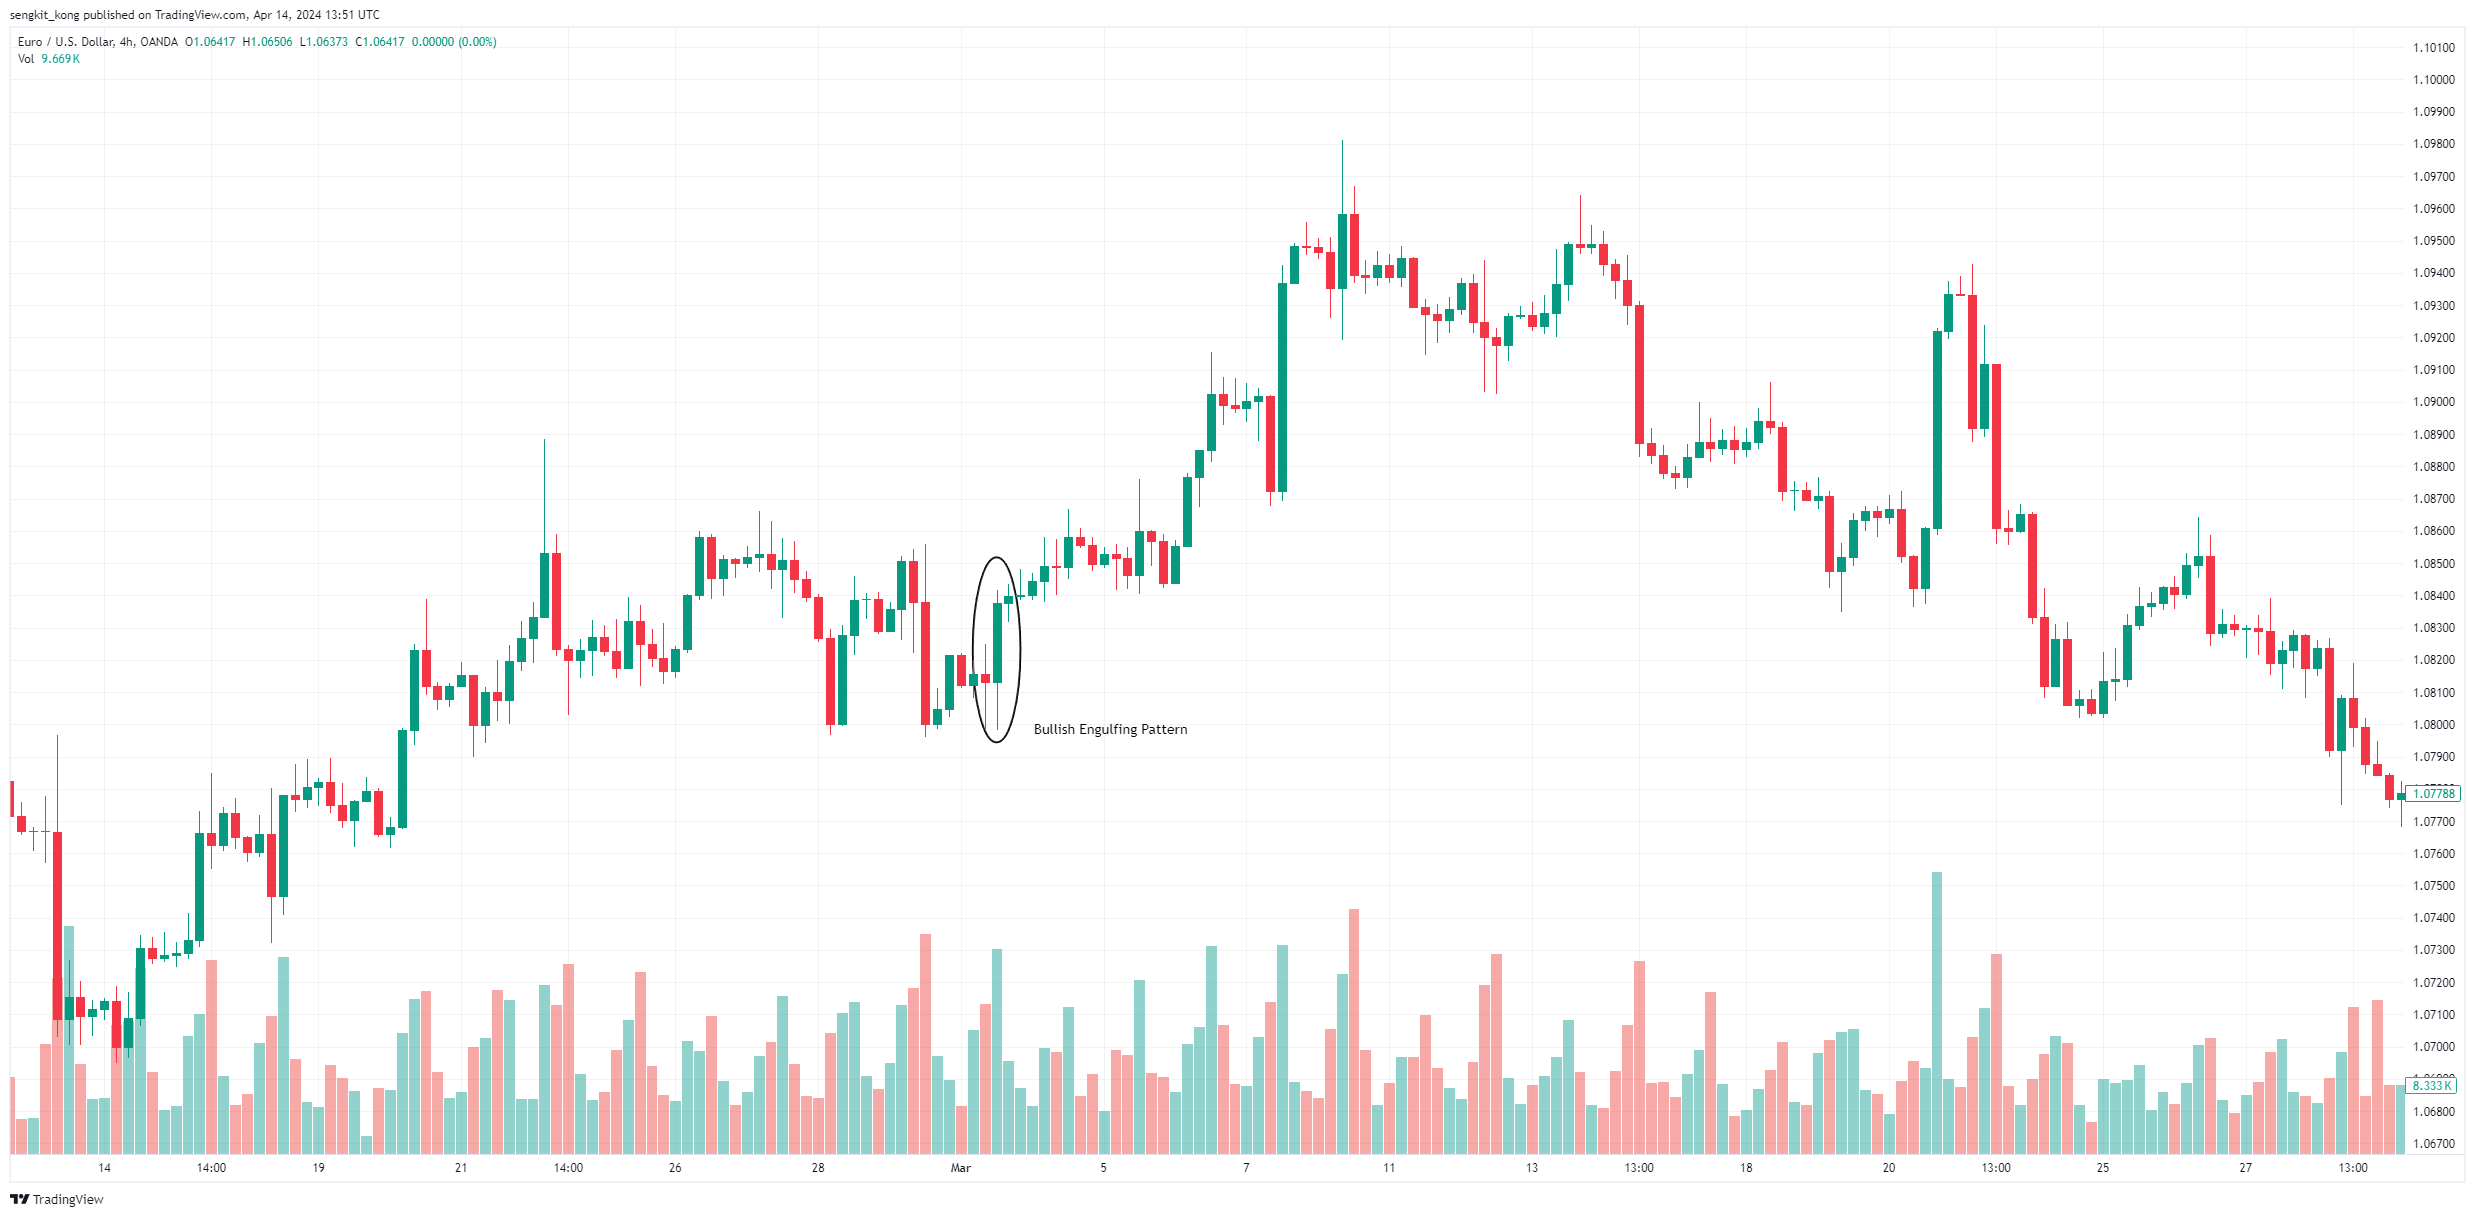
Upon identifying a bullish signal when the 50-day moving average crosses above the 200-day, the forex trader observes another bullish indicator through a bullish engulfing candlestick pattern, as shown in the chart below. In such trading scenarios, the trader can enter a long position while using a stop-loss to manage risk and setting a take-profit target based on their individual risk tolerance.
This approach illustrates a structured strategy that uses multiple technical indicators to validate each trading decision. By continuously monitoring the trade and employing suitable risk management techniques, forex traders can capitalise on market movements while managing potential losses through proper technical analysis.
Do bear in mind that knowing how to effectively use technical indicators to find entry and exit points, and to outline your trading strategy, takes time and experience. You can learn more about how to use technical analysis for your trading by attending our free webinars where our market analysts will discuss trade setups in detail.
Conclusion
Combined with the right strategies and tools, technical analysis may be relatively effective in identifying patterns on chart but certainly does not guarantee the prediction of future prices in the volatile financial market. Technical analysis aside, there are many other factors to consider in order to achieve long-term success in trading. Be it technical or fundamental analysis, you may find one approach that fits you best through trial and error, and continuous learning. Looking to take your first steps to conduct technical analysis? Practise with our demo account here.
References
- “Behavioral Finance in Joseph de la Vega’s Confusion de Confusiones – Tyalor & Francis Online”. https://www.tandfonline.com/doi/full/10.1080/15427560.2014.968722 . Accessed 5 Feb 2023.