You are visiting the international Vantage Markets website, distinct from the website operated by Vantage Global Prime LLP ( www.vantagemarkets.co.uk ) which is regulated by the Financial Conduct Authority ("FCA").
This website is managed by Vantage Markets' international entities, and it's important to emphasise that they are not subject to regulation by the FCA in the UK. Therefore, you must understand that you will not have the FCA’s protection when investing through this website – for example:
You will not be guaranteed Negative Balance Protection
You will not be protected by FCA’s leverage restrictions
You will not have the right to settle disputes via the Financial Ombudsman Service (FOS)
You will not be protected by Financial Services Compensation Scheme (FSCS)
Any monies deposited will not be afforded the protection required under the FCA Client Assets Sourcebook. The level of protection for your funds will be determined by the regulations of the relevant local regulator.
If you would like to proceed and visit this website, you acknowledge and confirm the following:
1.The website is owned by Vantage Markets' international entities and not by Vantage Global Prime LLP, which is regulated by the FCA.
2.Vantage Global Limited, or any of the Vantage Markets international entities, are neither based in the UK nor licensed by the FCA.
3.You are accessing the website at your own initiative and have not been solicited by Vantage Global Limited in any way.
4.Investing through this website does not grant you the protections provided by the FCA.
5.Should you choose to invest through this website or with any of the international Vantage Markets entities, you will be subject to the rules and regulations of the relevant international regulatory authorities, not the FCA.
Vantage wants to make it clear that we are duly licensed and authorised to offer the services and financial derivative products listed on our website. Individuals accessing this website and registering a trading account do so entirely of their own volition and without prior solicitation.
By confirming your decision to proceed with entering the website, you hereby affirm that this decision was solely initiated by you, and no solicitation has been made by any Vantage entity.
By providing your email and proceeding to create an account on this website, you acknowledge that you will be opening an account with Vantage Global Limited, regulated by the Vanuatu Financial Services Commission (VFSC), and not the UK Financial Conduct Authority (FCA).
Our website and services are not available to, and are not intended for, individuals who are citizens or residents of the United States, or entities incorporated in or conducting business within the United States.
If this does not apply to you and you believe you have received this message in error, please contact us at [email protected] for further assistance.
If you fall into any of the above categories, please exit the site.
Important Information
Thank you for visiting the Vantage Markets website. Please note that this website is intended for individuals residing in jurisdictions where accessing it is permitted by Vantage and its affiliated entities do not operate in your home jurisdiction.
By clicking 'I CONFIRM MY INTENTION TO PROCEED AND ENTER THIS WEBSITE', you confirm that you are entering this website solely based on your initiative and not as a result of any specific marketing outreach. You wish to obtain information from this website based on reverse solicitation principles, in accordance with the applicable laws of your home jurisdiction.
There are moments in the market when prices pause, gather strength, and quietly prepare for their next chapter.
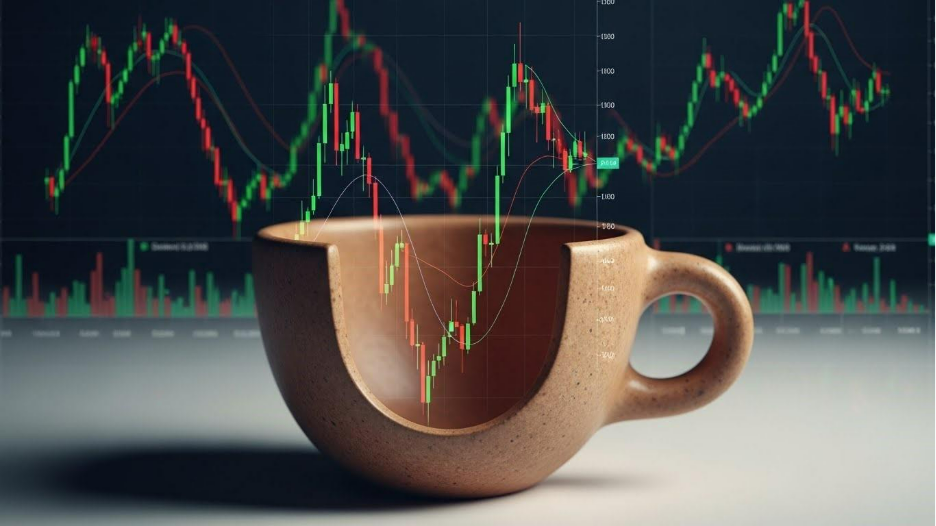
The cup and handle pattern is one of the chart formations traders may observe in such moments. It looks simple at first glance, almost like a teacup resting on a table, yet inside this gentle curve is a story of accumulation, confidence, and patient buyers returning to take control.
For newer traders, the cup and handle pattern can seem mysterious. Why does it look the way it does, and what is it trying to tell you? More importantly, how can you use it as part of your trade analysis?
In this guide, we break everything down with clear explanations, relatable analogies, and examples that make sense when applying the cup and handle pattern in your trading strategies.
What Is a Cup and Handle Pattern?
A cup and handle pattern is a bullish continuation pattern that signals renewed upward momentum. Picture a rounded ‘cup’ followed by a smaller ‘handle’, forming on the right side of a price chart.
The cup forms when the price drops from a previous high, slowly finds support, then climbs back to revisit that same high. On daily and weekly charts, this curved U-shape often develops over a steady period, reflecting a phase where sellers have faded, buyers have quietly accumulated, and sentiment has shifted back to optimism.
The handle forms when price hesitates near the old high. A small pullback appears, almost like the market catching its breath before breaking out. When buyers step back in and push the price above the handle’s resistance, it often sets the stage for a new upward run.
Is the Cup and Handle Pattern Bullish?
As a general rule, the cup and handle pattern is typically bullish. It shows that the market has absorbed selling pressure, regained confidence, and is preparing for another push upwards.
Think of it like an athlete slowing down, regrouping, and gathering energy before sprinting again.
History of the Cup and Handle Pattern
The cup and handle pattern was first introduced by William J. O’Neil in his book “How to Make Money in Stocks”. O’Neil had spent years studying how top-performing stocks behaved before their strongest climbs, and he noticed that many of them moved through a familiar cycle:
Prices would fall as fear took hold and sellers congregate, before forming a rounded recovery as confidence slowly returned, creating the ‘cup’.
A brief pullback would then emerge, signalling a moment of hesitation where early sellers tested the market’s resolve. This becomes the ‘handle’.
Once that final doubt passed, the price often breaks out with renewed conviction.
O’Neil realised he wasn’t just identifying a predictable chart pattern; he was mapping investor psychology. The shape captured how crowds behave when they shift from uncertainty to accumulation, a cycle that appears across various trading products on the market.
Although his original framework was designed for long-term investors who wanted to capture powerful multi-month trends, traders can adapt it for shorter time horizons by adjusting their measurements and targets.
Over the years, researchers have examined the cup and handle’s success rate and found that it strengthens with time. A cup typically forms over one to six months, followed by a handle lasting one to four weeks.
Studies also show that the pattern performs best on higher timeframes, especially daily and weekly charts where emotional cycles fully develop without intraday noise.
According to Thomas Bulkowski, a leading expert and author in trading, his market studies reveal a 65 to 70% success rate, with an average rise of 24% after breaking out past the resistance level1. These results are historical observations and do not guarantee future performance, which can vary significantly depending on market conditions.
In essence, the durability of the cup and handle pattern reflects a broader truth about market structure. When viewed over longer timeframes, price movements often mirror recurring shifts in sentiment, and this pattern captures that progression in a clear, recognisable way.
6 Key Rules to Identify a Cup and Handle Pattern
Here are the essential rules traders use to confirm that what they are seeing is a true cup and handle rather than a random curve on a chart.
1. There Must Be a Prior Uptrend
A cup and handle pattern is a bullish continuation signal, so it should form after an established upward trend.
Without a preceding uptrend, the pattern loses its context and becomes less reliable.
2. The Cup Must Be U-Shaped, Not V-Shaped
A valid cup forms gradually, creating a U shape with the price rounding out over time rather than snapping into a sharp V.
A rounded U shape shows sustained accumulation while a V shape usually reflects volatility or a fast corrective move, which reduces the reliability of any follow-through breakout.
Ideal Structure:
Fibonacci Depth: Around 50% retracement of the prior trend
Volume: Typically declines as price reaches the bottom
Cup Length: Longer cups (1–6 months) are typically stronger1
Base Depth: 12–35% pullback2
3. The Cup Should Take Longer to Form Than the Handle
The cup phase reflects accumulation and usually forms over weeks to several months, depending on the timeframe. The handle is a shorter consolidation phase, often lasting one to four weeks on daily charts.
A handle that lasts significantly longer than the cup may indicate weakening momentum or evolving market conditions that no longer support continuation.
A daily candle contains the activity of 24 one-hour candles, meaning volume and conviction are clearer on higher timeframes. This is why the cup and handle typically evaluates more reliably on daily or weekly charts.
4. The Cup’s Highs Should Align to Form Clear Resistance
The left and right sides of the cup should rise to nearly the same price level as before, creating a clean horizontal resistance line. This level becomes the key decision point where buyers and sellers meet—and where a breakout turns meaningful. A well-defined resistance line improves pattern clarity and increases technical validity.
5. The Breakout Must Occur Above the Handle’s High
The cup and handle pattern is not considered complete until price breaks above the handle’s resistance. A valid breakout should ideally occur with:
A strong bullish candle
A close above the resistance line
A handle that formed through tight consolidation
Without a clear breakout, the pattern remains unconfirmed and may simply represent a consolidation without continuation.
6. The Volume Must Confirm the Pattern
Volume plays a critical role in validating the cup and handle pattern.
Traders generally look for:
Decreasing volume as the cup forms
Lower volume during the handle
A surge of around 40% or more above the 20-period average can sometimes occur during a breakout. In some historical market examples, stronger breakouts have shown volume increases of 200%, 500%, or even 1,000%.2 However, these figures are illustrative only, as volume behaviour varies widely across instruments and market conditions.
Think of volume as a measure of market agreement where every trade is a vote of confidence. A breakout supported by thousands of ‘votes’ (broad participation) is more robust than one occurring on thin trading.
How to the Cup and Handle Pattern Is Commonly Traded
Trading a cup and handle pattern comes down to three essentials: (1) knowing where to enter, (2) where to place your stop, and (3) where to take profit. This technical chart pattern unfolds gradually, often building momentum over time.
Many traders aim to identify the confirmation point, step in at the right moment, manage risk appropriately, and let the move play out if conditions remain favourable.
Stage 1: Calculating the Target
To estimate a potential target, traders typically measure the depth of the cup—from the lowest point of the base up to the resistance line at the rim.
Once the price breaks out of the handle, this distance can be projected upward from the breakout level as an illustrative example. Actual market movements may differ, and no specific outcome is guaranteed.
Think of it like pouring water from a cup: The deeper the cup, the more potential energy it holds. Deeper cups may also indicate stronger underlying accumulation.
Short-term traders sometimes adapt this measurement by taking partial profits early or adjusting the projection based on their risk appetite and trading timeframe.
Stage 2: Finding the Entry Point
The handle is where timing matters. A healthy handle forms as a brief, controlled pullback—often a small downward-sloping channel, a mild dip, or a tight consolidation triangle.
Entries generally fall into two categories:
Aggressive Entry: Some traders may place a buy stop just above the handle’s trendline. This approach aims to capture the earliest phase of a potential breakout, though it carries a higher risk of false signals.
Conservative entry: Some traders wait for a confirmed breakout above the handle’s resistance and then look for a retest of the breakout level. This may provide additional confirmation, although the market does not always provide a pullback.
Volume can help validate the setup: Lighter volume during the handle suggests controlled selling or consolidation, while stronger volume on the breakout indicates increasing participation.
Stage 3. Placing the Stop-Loss
Stop-loss orders are usually placed below the handle’s low or the most recent swing low, depending on the market structure. Strong cup and handle patterns typically form in the upper half of the cup, ideally the upper third.
If the stop must be positioned below the midpoint of the cup, it may signal a weaker technical chart formation or an unfavourable risk-to-reward profile, prompting traders to reassess whether the setup is worth taking.
Stage 4. Choosing the Exit
Most traders use the cup depth added to the breakout point as their primary target projection.
More conservative traders may use a shorter measurement—especially if the cup is uneven—while aggressive traders may push for the full extension or scale out at multiple levels.
Intraday traders might close positions before the session ends due to volatility or session-based risk parameters, whereas trend-focused followers often trail their stop-loss to remain in the move as long as the trend persists.
5 Popular Strategy Tips for Trading a Cup and Handle Pattern
For traders who are new to the cup and handle chart pattern, these five commonly used tips offer additional insights to help evaluate the pattern more effectively. They are not trading signals but practical considerations that can support decision-making.
1. Prioritise Higher Timeframes
Cup and handle patterns tend to be clearer and more reliable on daily and weekly charts, where price movements are less affected by intraday noise. Higher timeframes provide a more accurate view of market sentiment and allow the pattern’s rounded base and handle to develop naturally.
While the pattern can appear on shorter timeframes, it may be more prone to false signals during volatile sessions.
2. Look for Supportive Market Context
A cup and handle pattern is more meaningful when it aligns with the broader market conditions. Traders often consider:
Whether the asset is already in a wider uptrend
If related markets or sectors are stable or strengthening
Whether broader economic or sentiment conditions support continuation
Evaluating the wider environment helps determine whether the pattern is forming as part of a continuation structure rather than against prevailing market pressure.
3. Avoid Handles That Are Too Deep or Too Long
A well-behaved handle usually pulls back only modestly, often staying in the upper half of the cup.
Handles that retrace too deeply, last excessively long, or show wide volatility may signal weakening momentum. This doesn’t invalidate the structure entirely, but it’s a sign to reassess whether market conditions still support continuation.
4. Use Additional Tools to Filter Breakouts
While the cup and handle pattern can be analysed on price action alone, many traders use complementary tools to help filter potential breakouts. These may include:
Moving averages to confirm trend direction
Momentum indicators like relative strength index (RSI) to check for divergence
Volume profile to identify high-participation zones
These tools don’t guarantee outcomes but can help reinforce whether a breakout aligns with broader technical conditions.
5. Plan Your Risk Management Before Entering
Cup and handle breakouts can be sharp. But like any other chart pattern, they can also fail, especially during periods of uncertainty or volatility.
Before entering, traders often define:
Maximum risk per trade
Preferred stop-loss placement
Acceptable risk-to-reward levels
Conditions that would invalidate the setup
Planning risk management in advance helps reduce emotional decision-making once the market begins to move.
6 Common Mistakes to Avoid When Evaluating a Cup and Handle Pattern
Even when a setup seems promising, many traders unintentionally weaken the structure long before the breakout happens. These six common mistakes often reduce the reliability of the cup and handle pattern—but they can be avoided with careful analysis and discipline.
1. Treating Shallow, V-Shaped, or Forced Structures as Cups
Not every rounded dip is a valid cup.
Sharp V-shaped reversals, overly shallow pullbacks, or patterns drawn from bias usually lack the gradual accumulation typically associated with a reliable breakout.
Before treating any curve as a cup, ensure the structure develops naturally, rounds out over time, and aligns with the key characteristics of a classical cup and handle pattern.
2. Overlooking the Quality of the Handle
A well-formed handle usually drifts gently lower or moves sideways within a relatively tight range. Handles that are too steep, choppy, or erratic may reflect weak consolidation and reduced buyer conviction.
When the handle lacks structure, the pattern may be more prone to false breakouts or inconsistent follow-through.
3. Entering Before Volume Confirms the Breakout
Volume often provides important context for this chart pattern, as it generally contracts during the handle and surges when the breakout occurs—ideally 40% to 50% above average, sometimes more.
Entering before volume expands can expose traders to shallow or short-lived moves, as a lack of participation may signal that buyers have not fully committed to the breakout.
4. Placing Stops Either Too Tight or Too Wide
Stop-loss placement plays a meaningful role in managing risk.
Stops placed inside the handle may be hit by normal fluctuations, while stops positioned too far below the structure can create an unfavourable risk-to-reward profile.
A balanced approach is to place stops just below the handle’s low or a nearby swing low, depending on market conditions and volatility.
5. Ignoring Market Context and Liquidity
Cup and handle patterns tend to form more cleanly in markets with sufficient liquidity and within an existing broader trend.
Attempting to apply the pattern during choppy conditions, low-volume periods, or counter-trend environments often results in irregular shapes and unreliable signals. Assessing trend strength, volatility, and liquidity helps determine whether the pattern is developing under supportive conditions.
6. Assuming Every Breakout Will Reach the Projected Target
The classical textbook target—the depth of the cup projected from the breakout point— is only a guide.
Breakouts with weaker momentum, lacklustre volume, or inconsistent follow-through tend to fall short of the projection. Treat the target as estimate, and manage trades based on evolving market conditions instead of relying solely on the measured-move calculation.
4 Limitations of the Cup and Handle Pattern
Like all technical chart patterns, the cup and handle is not perfect. Some limitations include:
1. False Breakouts
False breakouts can occur when momentum weakens, liquidity thins, or market conditions become unstable. Price may break above the handle’s resistance only to reverse shortly afterward, resulting in a false breakout.
While longer and more rounded cups are generally considered clearer structures, they do not guarantee reliability. Shallow or overly deep cups may introduce additional uncertainty, so evaluating the overall construction of the pattern is important before interpreting the breakout.
2. Timeframe Sensitivity
The cup and handle pattern often appears more clearly on higher timeframes, such as daily or weekly charts. On shorter intraday intervals, price action tends to be noisier, and the technical formation may be less distinct due to rapid fluctuations or temporary volatility.
Although the cup and handle pattern can form on any timeframe, it typically requires smoother, more orderly price movement to develop correctly—conditions that are more common on longer-term charts.
3. Structural Sensitivity to Volatility
The cup and handle pattern depends on gradual, rounded recovery followed by a controlled consolidation.
In highly volatile or uncertain markets, sudden large candles, sharp reversals, or wide intraday swings can distort the cup’s curvature or interrupt the handle, making the pattern harder to recognise.
Elevated volatility can also affect breakout behaviour, leading to inconsistent follow-through even when the breakout level is reached. As such, the pattern tends to be clearer when market conditions support steadier and more orderly price development.
4. Not Always Applicable Across All Instruments
Although the cup and handle pattern can appear across stocks, forex, indices, and commodities, its reliability can vary.
Instruments with low liquidity, wide spreads, or frequent gaps may struggle to form the smooth U-shape and tight handle that the pattern requires.
Additionally, markets prone to sudden news-driven movements may disrupt the structure, making the pattern less consistent across certain assets.
The Bottom Line for the Cup and Handle Pattern
More than just a visual shape, the cup and handle pattern is a powerful tool for understanding market behaviour. It tells a story of chart movements from decline to recovery, followed by a short period of consolidation and renewed upside momentum.
When interpreted within the broader trend, the cup and handle can help traders identify potential continuation setups. However, like any chart pattern, it should not be relied on in isolation.
It’s always best to combine the cup and handle pattern with trend analysis, momentum indicators, volume studies, and other chart structures to get a more complete picture of the markets.
Yes. The cup and handle is generally considered a bullish continuation pattern that signals renewed buying interest after a period of consolidation.
2. What are the rules for the cup and handle pattern?
The key rules for a cup and handle pattern include:
A prior uptrend
A rounded U-shaped cup
A relatively shallow downward- or sideway-sloping handle
Aligned highs forming a resistance level, and
A breakout above the handle, ideally supported by higher volume
These guidelines help distinguish a classical cup and handle from less reliable formations.
3. What is the success rate of the cup and handle pattern?
The success rate of the cup and handle pattern vary significantly across markets, instruments, and timeframes.
Research in technical analysis often shows clearer and more consistent performance on daily and weekly charts, where price action tends to be smoother and less affected by intraday noise.
Bear in mind that no success rate is guaranteed, and trading outcomes heavily depend on prevailing market conditions.
4. How often does the cup and handle pattern work?
The cup and handle pattern often works more consistently in steady trending environments where accumulation is visible and volatility is moderate.
Its reliability decreases in highly volatile, low-liquidity, or sideways markets, where the cup and handle structure may form irregularly or fail to complete.
Written on December 4, 2025 at 3:17 am, by chiayee
Comments Off on Cup and Handle Pattern Explained: A Comprehensive Guide
Please be advised that the trading of US stock UL, UK stock ULVR on Vantage’s platforms will be set to Close-Only mode across all servers starting from 02 December 2025.
We kindly request that any open positions be closed by the end of trading on Friday, 05 December 2025.
If positions are not closed by then, they will be automatically closed by us at the end-of-day price on 05 December 2025.
If you have any questions or require assistance, please do not hesitate to contact [email protected].
Of the many short-hands used in investing culture, perhaps few inspire as much excitement and hype as FAANG and the Magnificent Seven. These two popular terms refer to clusters of companies known for dominating the market, notably in tech, AI and related sectors.
While they may share clear similarities, these two groups represent different moments in the evolution of the market. Specifically, as technology stocks rose into prominence as major drivers of the market, investor focus shifted from FAANG to the Magnificent Seven in tandem.
While FAANG (which came earlier) captured the rise of internet platforms, digital advertising and streaming services, the Magnificent Seven reflects a more contemporary mix of artificial intelligence, cloud computing, electric vehicles and platform ecosystems.
Understanding what FAANG and the Magnificent Seven represent can help readers understand how market leadership has evolved over time and why a handful of companies can have such a large influence on global indices.
Key Points
FAANG captured the rise of internet platforms and digital services, while the Magnificent Seven reflects a newer era driven by AI, cloud computing, and advanced hardware.
The Magnificent Seven now holds a much larger share of the S&P 500, showing how market leadership has shifted toward companies shaping deeper technological infrastructure.
This shift has increased index concentration, meaning a handful of mega-cap stocks now influence broader market movements far more than in the FAANG era.
Understanding FAANG Stocks and Their Rise
The FAANG acronym refers to Facebook (now Meta Platforms), Amazon, Apple, Netflix and Alphabet, the parent company of Google. It emerged during a period when these firms were at the forefront of digital transformation, marked by the rise of social media, streaming and ever more digital lifestyles.
The term began as “FANG”, popularised by market commentator Jim Cramer to describe the runaway success of Facebook, Amazon, Netflix and Google in 2013. Later, in 2017, Apple was added to the group, making up the second “A” [1].
The updated acronym, FAANG, quickly caught on among analysts and retail investors, becoming shorthand for the most powerful technology stocks that were exhibiting spectacular growth in the market.
Let’s examine each of these five stocks in turn.
Facebook (now Meta Platforms)
The rise of FAANG was closely linked to a dramatic shift in how people used technology. Social media took centre stage as Facebook became the primary platform for online interaction, emerging as a clear winner that gobbled up market share and users from earlier platforms such as MySpace and Friendster.
Facebook offered a more full-featured social media platform, empowering users with the ability to integrate photos, messaging, groups and a personalised news feed, creating a level of engagement those earlier platforms could not match. As more people brought their social lives online, Facebook became a daily habit for millions, anchoring itself at the heart of the digital experience and setting the tone for the broader social media landscape.
Amazon
Amazon – perhaps the most well-known survivor of the 2000’s dot-com bubble collapse – emerged from the rubble to reshape shopping habits by accelerating the adoption of e-commerce and efficient home delivery.
In essence, the company succeeded by pivoting from selling books to solving the logistical challenges that stood in the way of speedy home delivery, famously creating “same-day delivery” – a standard that could only be dreamed of previously.
Apple
Apple’s rise during the FAANG era stemmed from its ability to shape not only consumer behaviour but the direction of the entire technology ecosystem. The launch of the first iPhone in 2007 transformed the company from a computer manufacturer into the architect of the modern mobile world.
By tightly integrating hardware, software and services, Apple created an ecosystem that encouraged loyalty and made it difficult for competitors to replicate the overall experience. Innovations such as the App Store, iCloud and Apple Music expanded the company’s reach far beyond devices, turning day-to-day digital interactions into recurring revenue streams.
This blend of premium hardware and fast-growing services positioned Apple as a central pillar of the tech economy, influencing everything from app development to global supply chains.
Netflix
Netflix, for its part, became one of the defining disruptors of the FAANG era by spearheading the transition from physical media to online entertainment. What began as a DVD-by-post business gradually evolved into a platform that changed how people consumed film and television.
Most notably, Netflix fostered the rise of binge watching by dropping entire seasons of television shows, instead of releasing episodes on a weekly schedule. This helped the brand cement its place in popular culture, generating valuable word-of-mouth.
By investing heavily in streaming technology and later in original productions, Netflix broke the traditional dominance of broadcast networks and cable providers. Its hit series and films attracted a global subscriber base, proving that viewers were ready to move away from scheduled programming towards on-demand content.
This shift not only transformed entertainment habits but forced the entire media industry to rethink distribution, rights management and production strategies, with many legacy companies scrambling to catch up.
Google (Alphabet)
Alphabet’s influence grew out of its position as the backbone of online information. Through Google Search, the company became the primary gateway to the internet, shaping the way billions of people accessed knowledge, news and services. Its advertising platform, powered by detailed data insights and sophisticated algorithms, allowed businesses of all sizes to reach targeted audiences with unprecedented precision, cementing Google’s dominance in the digital advertising market.
At the same time, the Android operating system enabled Alphabet to establish a vast foothold in the global smartphone market, particularly in regions where lower-cost devices were essential for widespread adoption. This combination of search, advertising and mobile technology made Alphabet not just a dominant tech company, but an essential infrastructure provider for the digital age.
The rise of FAANG
Each of these five companies achieved impressive growth in their own right. But what truly set FAANG stocks apart was the speed at which they captured market share and embedded themselves in everyday life.
Each company benefited from the network effects of the internet era, where user growth reinforced product relevance and revenue expansion. As their profits grew, so did their market capitalisation, making them some of the most influential members of indices such as the S&P 500.
At one point, FAANG stocks together accounted for a significant share of the index, and their performance often shaped broader market sentiment. When these companies delivered strong results, markets tended to rally. When they faltered, markets frequently cooled.
The FAANG era is often associated with the 2010s, a decade defined by mobile technology, platform monetisation and the explosive rise of online advertising. The companies’ ability to grow revenue at a rapid pace, coupled with their dominance in their respective industries, established them as the core engines of American technology leadership during that period.
Understanding Magnificent Seven Stocks and Their Rise
While FAANG defined one era, the Magnificent Seven delineated another. This newer group includes Apple, Microsoft, Amazon, Alphabet, Meta Platforms, Nvidia and Tesla. The term gained traction among analysts who wanted to capture the influence of a broader set of companies leading the market.
Unlike FAANG, which concentrated heavily on internet platforms and advertising, the Magnificent Seven reflects a more diverse technological frontier, driven by artificial intelligence, cloud infrastructure, electric vehicles and advanced semiconductors.
This broader mix captures the reality that modern tech leadership is no longer defined by online platforms alone, but by companies building the underlying hardware, infrastructure and energy systems that power the digital world. It also shows how innovation has shifted from consumer apps to deeper, more foundational technologies that shape entire industries.
Microsoft, Amazon and Alphabet – The power of the cloud
The inclusion of Microsoft marks one of the most important differences between the new and old groupings. Microsoft had long been a giant in enterprise software, but its growth accelerated significantly as cloud computing became central to corporate operations.
The success of cloud computing service Azure transformed the company from a traditional software provider into one of the world’s most influential cloud infrastructure leaders, placing it at the heart of digital transformation across industries.
This shift mattered because it brought a different kind of technological power into the mix: rather than relying on advertising or consumer platforms, Microsoft’s dominance came from supplying the digital foundations that governments, businesses and developers rely on every day. Its presence in the Magnificent Seven highlights how market leadership has expanded beyond consumer tech into the deeper layers of enterprise infrastructure.
Amazon and Alphabet also benefited from this shift through their extensive cloud platforms, making cloud infrastructure one of the defining technologies of the modern era. Amazon Web Services became the engine behind much of the internet, powering everything from start-ups to global enterprises and generating a significant share of Amazon’s overall profits.
Alphabet’s Google Cloud, while smaller, became a crucial player in areas such as data analytics, artificial intelligence tools and enterprise services, reinforcing the company’s role beyond search and advertising. Together with these cloud businesses helped move the conversation away from consumer-facing apps toward the backbone technologies that enable digital innovation.
Meta Platforms – The future is social
Meta Platforms remained part of the Magnificent Seven due to its scale and continued influence across social media and advertising, despite the challenges of competition and regulatory scrutiny. Its vast user base gave it a degree of global reach unmatched by most companies, and its ability to shape online communication kept it central to the digital economy.
Over the years, Meta refined its platforms to keep users engaged for longer and advertisers returning, turning Facebook, Instagram and WhatsApp into essential digital hubs for billions of people. Furthermore, Meta’s investments in new technologies – including virtual and augmented reality – signalled its intention to play a role in the next stage of the internet’s evolution.
These long-term bets showed that Meta is not content to remain merely a social media company, but aims to influence how people might interact, work and socialise in future digital environments. This combination of scale, structural influence and ongoing innovation is what secures Meta’s place within the Magnificent Seven, keeping it aligned with the companies driving the next wave of technological change.
Nvidia and Tesla – Completing the Magnificent Seven
Two companies that transformed the technology narrative appear only in the Magnificent Seven: Nvidia and Tesla. Nvidia grew from a graphics card producer to a major supplier of chips used for artificial intelligence and high-performance computing. Its hardware plays a significant role in training large AI models and supporting data-intensive applications. According to publicly available market data, Nvidia’s valuation increased substantially in recent years, reflecting heightened demand for AI-related hardware [2].
Tesla, meanwhile, played a critical role in bringing electric vehicles into the mainstream. What began as a niche automaker producing high-priced performance cars quickly evolved into a company capable of reshaping the entire automotive landscape. Its heavy investment in battery technology allowed Tesla to push the limits of range and efficiency, helping convince consumers that electric vehicles could be both practical and desirable.
At the same time, its work on autonomous-driving software positioned the company at the frontier of automotive innovation, blurring the line between car manufacturing and advanced computing. Tesla’s ambition extended beyond vehicles, with its energy-storage products and solar operations framing the company as a broader clean-energy ecosystem rather than a traditional automaker.
This strategic positioning placed Tesla at the centre of a technological shift focused on sustainability, electrification and software-driven mobility. Public market data shows that Tesla’s valuation increased significantly over the years, influenced by investor expectations around electric-vehicle development and related technologies. These valuations reflect market sentiment at different points in time rather than guarantees of future performance [3].
How the Magnificent Seven Took Over
Collectively, the Magnificent Seven hold an even larger share of the S&P 500 than the FAANG stocks did in their prime. FAANG stocks made up close to 20% of the S&P 500 as at late-2025; meanwhile the Magnificent Seven was estimated to take up 36.19% of the S&P 500 in October 2025 [4,5].
The transition from FAANG to the Magnificent Seven did not happen overnight. Instead, it unfolded gradually as new technologies emerged and investor attention shifted.
During the past several years, artificial intelligence became one of the most significant drivers of both corporate strategy and market sentiment. As detailed above, Nvidia stood out as a central player in this trend, supplying the specialised chips that power AI models (essentially, selling spades during a gold rush). This new source of demand propelled Nvidia into the same league as the other mega-caps, reflecting how vital AI had become to global technological competition.
At the same time, cloud computing continued its relentless expansion. Companies increasingly relied on cloud-based systems for storage, cybersecurity, analytics and digital operations. This bolstered the position of Microsoft and Amazon, whose cloud divisions formed the backbone of many corporate IT strategies. Their success showed that infrastructure and enterprise services were becoming just as important as consumer-facing platforms.
The rise of electric vehicles added another dimension to the shift in market leadership. Tesla’s technological approach to batteries, manufacturing and software opened a new chapter in transport innovation. Investors viewed the company not only as a car manufacturer but also as a major force in the push towards clean energy and automation. This differed significantly from the earlier FAANG landscape, which focused more on digital platforms than physical technologies.
As these trends gathered momentum, it became clear that the original FAANG label no longer captured the breadth of modern tech-driven growth. The Magnificent Seven emerged as a more accurate reflection of the companies shaping the next phase of technological progress. Their combined weighting in major US indices grew so large that they often accounted for a notable portion of total market gains. When the Magnificent Seven performed strongly, markets tended to rise with them. When they cooled, their sheer size meant that broader indices often softened as well.
This shift highlights how market leadership evolves in response to new ideas, new technologies and new business models. Whereas the FAANG era was defined by digital platforms, the Magnificent Seven era is characterised by AI, cloud computing, electric vehicles and integrated ecosystems that reshape how individuals and businesses interact with technology.
Key Similarities and Differences Between FAANG and The Magnificent Seven
Feature
FAANG
Magnificent Seven
Companies included
Meta (Facebook), Amazon, Apple, Netflix, Alphabet (Google)
Apple, Microsoft, Amazon, Alphabet, Meta, Nvidia, Tesla
Technological focus
Internet platforms, digital advertising, streaming, e-commerce
Artificial intelligence, cloud infrastructure, electric vehicles, social platforms, hardware ecosystems
Era of prominence
Mid-2010s to late 2010s
Early 2020s onwards
Influence on major indices
Significant but centred on platform businesses
Larger overall influence, driven by broader technological themes
Risk factors
Regulatory pressure, slowing user growth, competition in digital platforms
High valuations, supply-chain exposure, hardware complexity, concentration risk
AI advancements, cloud services, EV adoption, semiconductor innovation
What the Shift Means for Investors and Traders
The shift from FAANG to the Magnificent Seven reflects broader changes in the technology landscape and how market participants have responded to evolving themes over time.
For market observers, one notable point is that the definition of “big tech” today is broader and more diverse than it was a decade ago. Many of the companies leading the market now operate in fields that extend far beyond their original sectors, such as social media and online platforms. Artificial intelligence, electric mobility and cloud infrastructure are all shaping the next chapter of growth.
Increasing Index Dominance Brings Risk
At the same time, the increasing dominance of a small set of companies means that risks can become concentrated in ways many investors may fully appreciate. When just a handful of firms make up a substantial portion of a broad index such as the S&P 500, their share-price movements exert far more influence on the overall index than the hundreds of smaller companies sitting alongside them.
This dynamic means that some market participants tracking broad indices may be more exposed to these large companies than they realise.
This concentration can distort portfolio behaviour. A strong rally among the Magnificent Seven can push an index higher even when other companies are flat or falling, which may give the impression of broad market strength even if underlying performance is uneven.
Likewise, if even one or two of these dominant firms stumble (whether due to weaker earnings, regulatory issues or a change in market sentiment) the impact can ripple disproportionately through the index.
The result is that portfolios tied to these indices can experience sharp swings that do not necessarily reflect the wider health of the market or economy.
Conclusion: What This All Means for Traders
Some traders monitor these groupings as indicators of broader market sentiment. Movements in large-cap technology stocks are sometimes viewed by market participants as reflecting shifts in confidence toward certain sectors or themes. These observations vary among traders and do not predict market direction. Many traders pay particular attention to earnings reports for technology leaders, as their results can influence both volatility and direction in the broader market.
On a broader level, the shift from FAANG to the Magnificent Seven illustrates how technological transitions have influenced different phases of market leadership. The companies that dominated one era may not necessarily dominate the next, and periods of disruption can create opportunities for firms that bring new ideas to the table.
From an educational perspective, concentration in a small set of companies can lead to narrower exposure to market movements. Some market participants consider a broader mix of sectors or themes when analysing diversification concepts, although approaches vary widely depending on individual objectives and risk tolerance.
Written on December 3, 2025 at 3:02 am, by chiayee
Comments Off on FAANG vs Magnificent Seven: What’s the Difference?