


Gold Price News: XAUUSD Holds $4,000 as Fed Hike Odds Hit 59%
 Updated Updated Fri, 2026 July 17 09:03

Gold (XAUUSD) last traded at $3,986.40 as of 17 July 2026, 11:42 (GMT+8) / 03:42 UTC, holding just above the closely watched $4,000 area after a rough few weeks. The XAUUSD price remains sharply below the all-time high of $5,602.23 it touched on 29 January 2026[1], and the gold price news this fortnight has been shaped by two forces pulling in opposite directions: an escalating Middle East conflict pushing oil and inflation expectations higher, and a new Fed Chair using his first congressional testimony to spell out how much tolerance he has for price pressure.
This piece runs through what the 4-hour chart is showing, the drivers behind the past week’s XAUUSD news, and the levels traders are watching into the next Federal Reserve meeting. All prices are as of 17 July 2026, 11:42 (GMT+8) / 03:42 UTC. Charts are indicative and sourced from TradingView via the Vantage CFD feed. This is not financial advice.
Key Points
- Gold trades near $3,986, holding just above the $4,000 area after touching a fresh multi-week low, and remains well below the all-time high above $5,600 set in January.
- Fed Chair Kevin Warsh used his first congressional testimony this week to reiterate limited tolerance for elevated inflation, and CME FedWatch data now points to roughly a 59% probability of a rate hike in September [2].
- The 50-period and 200-period moving averages on the 4-hour chart both sit above the current price, while the RSI near 37 points to momentum still leaning to the downside.
XAUUSD Technical Analysis: What the Chart Is Showing
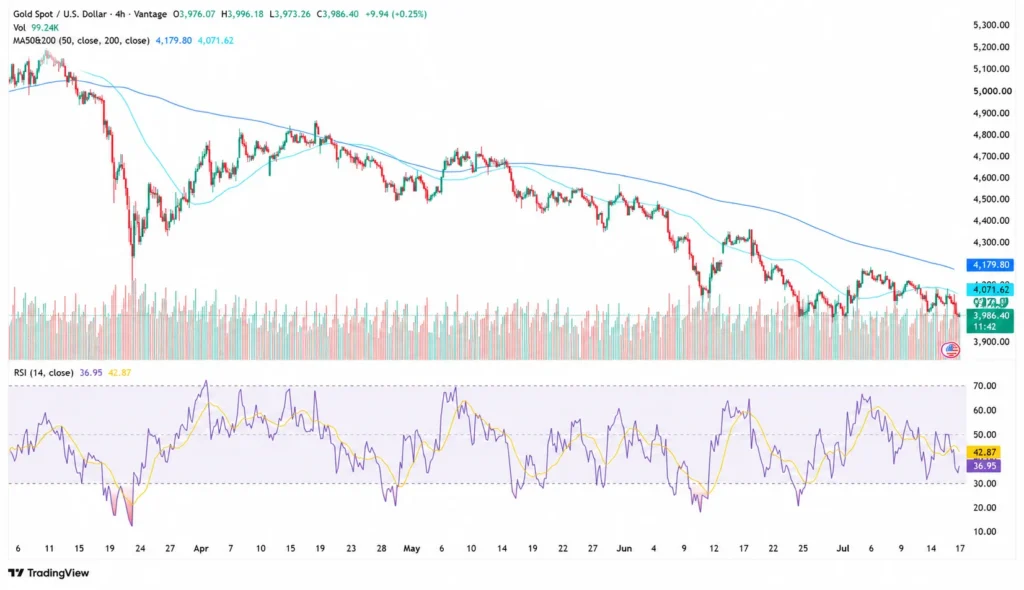
The 4-hour XAUUSD chart opened the session at $3,976.07, reached an intraday high of $3,996.18 and a low of $3,973.26, and last traded at $3,986.40, up $9.94 or 0.25% on the session, per the TradingView setup used for this analysis. Session volume stood near 99.24K.
The chart’s moving average overlay shows the 50-period 4H moving average at 4,179.80 and the 200-period 4H moving average at 4,071.62, both per the TradingView setup used for this analysis. Price is currently trading below both, a setup that has held through most of the pullback from the January peak.
The RSI (14) sits at 36.95, with its moving average overlay at 42.87. That is not yet in oversold territory below 30, but it is consistent with the broader loss of upside momentum that has characterised gold since the spring.
Gold lost its bullish momentum after rising more than 2% the previous week, then registered further losses as Middle East tensions escalated [6]. Since the January all-time high, gold prices have been through a volatile round trip: a rebound into the $4,800 to $4,900 zone through April and May, then a steady grind lower through June and July, taking it back toward $4,000, where it has spent the past two weeks in a narrow range as investors weigh the Fed’s policy outlook [7].
What’s Driving Gold This Week

The Middle East conflict and the energy shock
Fighting in the Middle East intensified again this week, with fresh US strikes on Iranian military targets and continued tension around the Strait of Hormuz keeping crude oil elevated [3]. New York Fed President John Williams noted the conflict poses what he called significant risks that the US economy has so far absorbed [3], while softer inflation prints this week have been partly offset by the energy backdrop.
For gold, this is an awkward mix. A geopolitical risk premium would normally support the metal as a haven, but the same conflict is keeping oil, and by extension inflation expectations, elevated, which supports the case for tighter Fed policy and works against non-yielding assets like gold.
Kevin Warsh’s first testimony as Fed Chair
Kevin Warsh, confirmed as Fed Chair in May 2026, delivered his first Semiannual Monetary Policy testimony to Congress this week as part of what has been billed as his Capitol Hill debut [4]. He told lawmakers the central bank has “no tolerance for persistently elevated inflation,” a line markets read as leaving the door open to further tightening rather than confirming the easing many had expected earlier in the year [2].
That followed a June policy meeting where the Fed held rates steady, but the dot plot shifted in a more hawkish direction, with Warsh reiterating a price-stability commitment that leaves the door open for at least one rate hike by year end [5]. At the time of writing, markets were pricing roughly a 59% probability of a rate hike in September, according to the CME FedWatch Tool [2], a marked shift from the rate-cut expectations that dominated earlier in the year.
Read the latest gold news today here.
Softer inflation data, but not soft enough
The Producer Price Index for June eased to 5.5% year-on-year from 6%, below the 6.2% consensus estimate, following a cooler-than-expected Consumer Price Index reading earlier in the week [3]. On paper, that is positive for the Fed’s inflation fight. In practice, the energy-driven risk from the Middle East conflict has helped keep markets cautious about declaring inflation risks fully resolved, underscoring how unusual the current setup is.
Levels to Watch
The table below covers the zones traders are monitoring on XAUUSD, drawing on the same moving-average and RSI framework used throughout this XAUUSD technical analysis. These are reference levels, not trade signals.
| Pair | Support | Resistance | What’s happening |
| XAUUSD | 3,900 / 3,973 | 4,071 / 4,179 | Trading below both the 50-period and 200-period 4H moving averages; $4,000 a psychological pivot |
Table 1: Key levels as of 17 July 2026, 11:42 (GMT+8) / 03:42 UTC. Sources: TradingView, FXStreet, Kitco News. [1,4,5] Indicative only.

What to Watch This Week and Beyond
For traders following gold news and XAUUSD price action, the calendar ahead is dense:
- FOMC Meeting, 28-29 July 2026: the next scheduled Federal Reserve policy meeting, with the rate decision due on 29 July
- Strait of Hormuz Developments: any credible de-escalation would ease the energy-driven inflation risk currently supporting Fed hike pricing
- Fed Speakers: further remarks from Committee members following Warsh’s testimony could adjust the market’s read on September
- $4,000 Psychological Level: a sustained break in either direction from this pivot area is a key focus for chart watchers
On risk management, gold has been reacting to Middle East headlines and Fed commentary within minutes of release this week. Stop Loss placement relative to the 3,900 to 3,973 support band and the 4,071 to 4,179 resistance band matters more than usual in this kind of headline-driven environment. A Stop Loss can help limit losses to a planned size, though it does not remove risk entirely.
Leverage works both ways in a range this choppy, amplifying gains as easily as losses. Position sizing relative to account equity is worth revisiting ahead of the 28-29 July FOMC meeting, particularly for traders holding correlated exposure across other USD-sensitive instruments.

RISK WARNING: CFDs are complex financial instruments and carry a high risk of losing money rapidly due to leverage. You should ensure you fully understand the risks involved and carefully consider whether you can afford to take the high risk of losing your money before trading.
Disclaimer: The information is provided for educational purposes only and doesn’t take into account your personal objectives, financial circumstances, or needs. It does not constitute investment advice. We encourage you to seek independent advice if necessary. The information has not been prepared in accordance with legal requirements designed to promote the independence of investment research. No representation or warranty is given as to the accuracy or completeness of any information contained within. This material may contain historical or past performance figures and should not be relied on. Furthermore estimates, forward-looking statements, and forecasts cannot be guaranteed. The information on this site and the products and services offered are not intended for distribution to any person in any country or jurisdiction where such distribution or use would be contrary to local law or regulation.
References
[1] “XAUUSD Chart – Gold Spot US Dollar Price – TradingView” https://www.tradingview.com/symbols/XAUUSD/ Accessed on 17 July 2026.
[2] “Gold slips as oil rally keeps inflation, rate outlook on investors’ radar – CNBC” https://www.cnbc.com/amp/2026/07/15/gold-slips-as-oil-rally-keeps-inflation-rate-outlook-on-investors-radar.html Accessed on 17 July 2026.
[3] “Gold price slips as Iran escalation overshadows soft US PPI – FXStreet” https://www.fxstreet.com/news/gold-price-slips-as-iran-escalation-overshadows-soft-us-ppi-202607151759 Accessed on 17 July 2026.
[4] “Gold struggles around $4,100 as markets await CPI and Warsh’s Capitol Hill debut – Kitco News” https://www.kitco.com/news/article/2026-07-10/gold-struggles-around-4100-markets-await-cpi-and-warshs-capitol-hill-debut Accessed on 17 July 2026.
[5] “Gold edges lower as elevated oil prices bolster Fed hike prospects and offset soft USD – FXStreet” https://www.fxstreet.com/news/gold-edges-lower-as-elevated-oil-prices-bolster-fed-hike-prospects-and-offset-soft-usd-202607150350 Accessed on 17 July 2026.
[6] “Gold Forecast: Bulls retreat ahead of US CPI and Warsh testimony – FXStreet” https://www.fxstreet.com/analysis/gold-weekly-forecast-renewed-middle-east-tensions-scare-bulls-away-202607101506 Accessed on 17 July 2026.
[7] “Gold – Price, Chart, Historical Data, News – Trading Economics” https://tradingeconomics.com/commodity/gold Accessed on 17 July 2026.
[8] “FOMC Meeting Calendar, July 2026 – Federal Reserve” https://www.federalreserve.gov/newsevents/2026-july.htm Accessed on 17 July 2026.