Every December, discussions around the Santa Rally return as traders and analysts examine whether US equities will show their familiar year-end strength. Seasonal patterns have long shaped expectations, but each year brings its own economic backdrop, policy shifts, and market psychology.
As we move through 2025, interest in this topic remains strong, especially after the S&P 500 ended 2024 at record levels but did not deliver a Santa Rally, breaking from the long-term seasonal pattern.
Understanding why December often behaves differently, and what drove the most recent year-end move, can offer helpful context for how seasonal effects fit into broader market behaviour.
Key Points
- December has historically been one of the strongest months for US equities, supported by year-end flows, investor sentiment, and institutional rebalancing.
- The Santa Rally did not occur in 2024, with the S&P 500 falling during the traditional seven-session window.
- Seasonal trends remain relevant in 2025, although economic data, monetary policy signals, and broader market conditions continue to influence how the period plays out.
What Is the Santa Rally?
The Santa Rally refers to a seasonal pattern in which the US stock market often rises during a specific seven-day window: the final five trading days of December and the first two trading days of January. This trend has been observed for decades and remains one of the most widely discussed features of market seasonality.
Although there is no single explanation for why this period tends to be positive, several recurring factors are frequently highlighted. Market liquidity often improves towards year-end, institutional investors carry out portfolio rebalancing, and sentiment can lift as economic uncertainties moderate into the holiday period. In addition, some analysts note that investors may reposition for the year ahead, particularly after periods of strong earnings or stable macroeconomic conditions.
It is important to recognise that seasonal patterns are not guaranteed. Market reactions can vary from year to year, especially during periods of heightened volatility or significant macroeconomic developments. Even so, the Santa Rally continues to attract attention because of its longevity and the consistency of its historical data.
Historical December Performance: What the Data Shows
December has long been one of the more closely observed months in the US equity calendar. Analysts frequently refer to it when discussing seasonality, not because patterns provide certainty, but because the consistency of past results offers helpful context for understanding how markets sometimes behave at year-end.
Why December Has Historically Been Strong
Several structural and behavioural factors often contribute to December’s resilience:
- Year-end portfolio adjustments: Asset managers typically rebalance their positions to align portfolios with investment mandates. This activity can create additional demand for equities, particularly in indices such as the S&P 500.
- Improved sentiment during the holiday period: December often brings a calmer macro environment, encouraging a more positive tone among market participants.
- New-year positioning: Some investors begin allocating ahead of January, especially after years with strong corporate earnings or stable growth conditions.
- Tax-related flows: In certain regions, selling and repurchasing strategies for tax purposes can create short-term movements in equity markets.
While none of these factors ensures higher prices, they help explain why December has historically shown relatively strong performance compared with other months.
The Seven-Day Santa Rally Pattern [1]
The Santa Rally refers to a defined seven-session window covering the final five trading days of December and the first two trading days of January. The pattern was first identified in 1972 by Yale Hirsch, founder of the Stock Trader’s Almanac. Historical data shows that this period has delivered higher equity prices around 79% of the time since 1950, with the S&P 500 averaging a gain of about 1.3% during these sessions.
Analysts often observe this window closely because seasonal factors such as thinner trading volumes, repositioning at year-end, and improving sentiment can influence short-term market movements. Instances where the Santa Rally does not appear have also drawn attention.
For example, a 4.0% decline in 1999 was followed by a significant downturn in the Dow over the next few years, and weakness in late 2007 preceded the broader stress that culminated in the 2008 financial crisis.
Related article: Stock Market Crashes in History: Causes, Consequences, and Lessons
While historical tendencies do not serve as a guide to future performance, the consistency of the data helps explain why the Santa Rally remains a point of interest in seasonal market analysis each December.
How the Santa Rally Played Out in 2024
The end of 2024 offered a notable deviation from the long-term pattern typically associated with the Santa Rally. Despite a strong year overall for US equities, the final stretch of December displayed a weaker tone, resulting in a rare instance where the Santa Rally did not materialise.
This outcome stood in contrast to historical tendencies, where the last five trading days of December and the first two of January have often produced positive market performance.
Year-End Market Conditions in 2024
Throughout the final quarter of 2024, the S&P 500 experienced periods of strength, including a clear rise from mid-October through November. However, as December progressed, the market became more uneven. The chart reflects this shift, with price action turning more volatile and trending lower in the final weeks of the year.
A combination of factors shaped this environment. Inflation continued easing towards the Federal Reserve’s longer-term objective, but market participants were still assessing how policy decisions might evolve in 2025. Corporate earnings remained generally stable, while consumer spending held its ground.
Political clarity following Donald Trump’s return to the presidency reduced some earlier uncertainty, although discussions around taxation, regulation, and fiscal direction continued into the year-end.
Liquidity conditions were typical for the holiday period — with thinner volumes and pockets of volatility — but they did not generate the positive drift often seen during December. Instead, the broader tone became more cautious as investors reassessed expectations for the year ahead.
A Santa Rally That Did Not Materialise
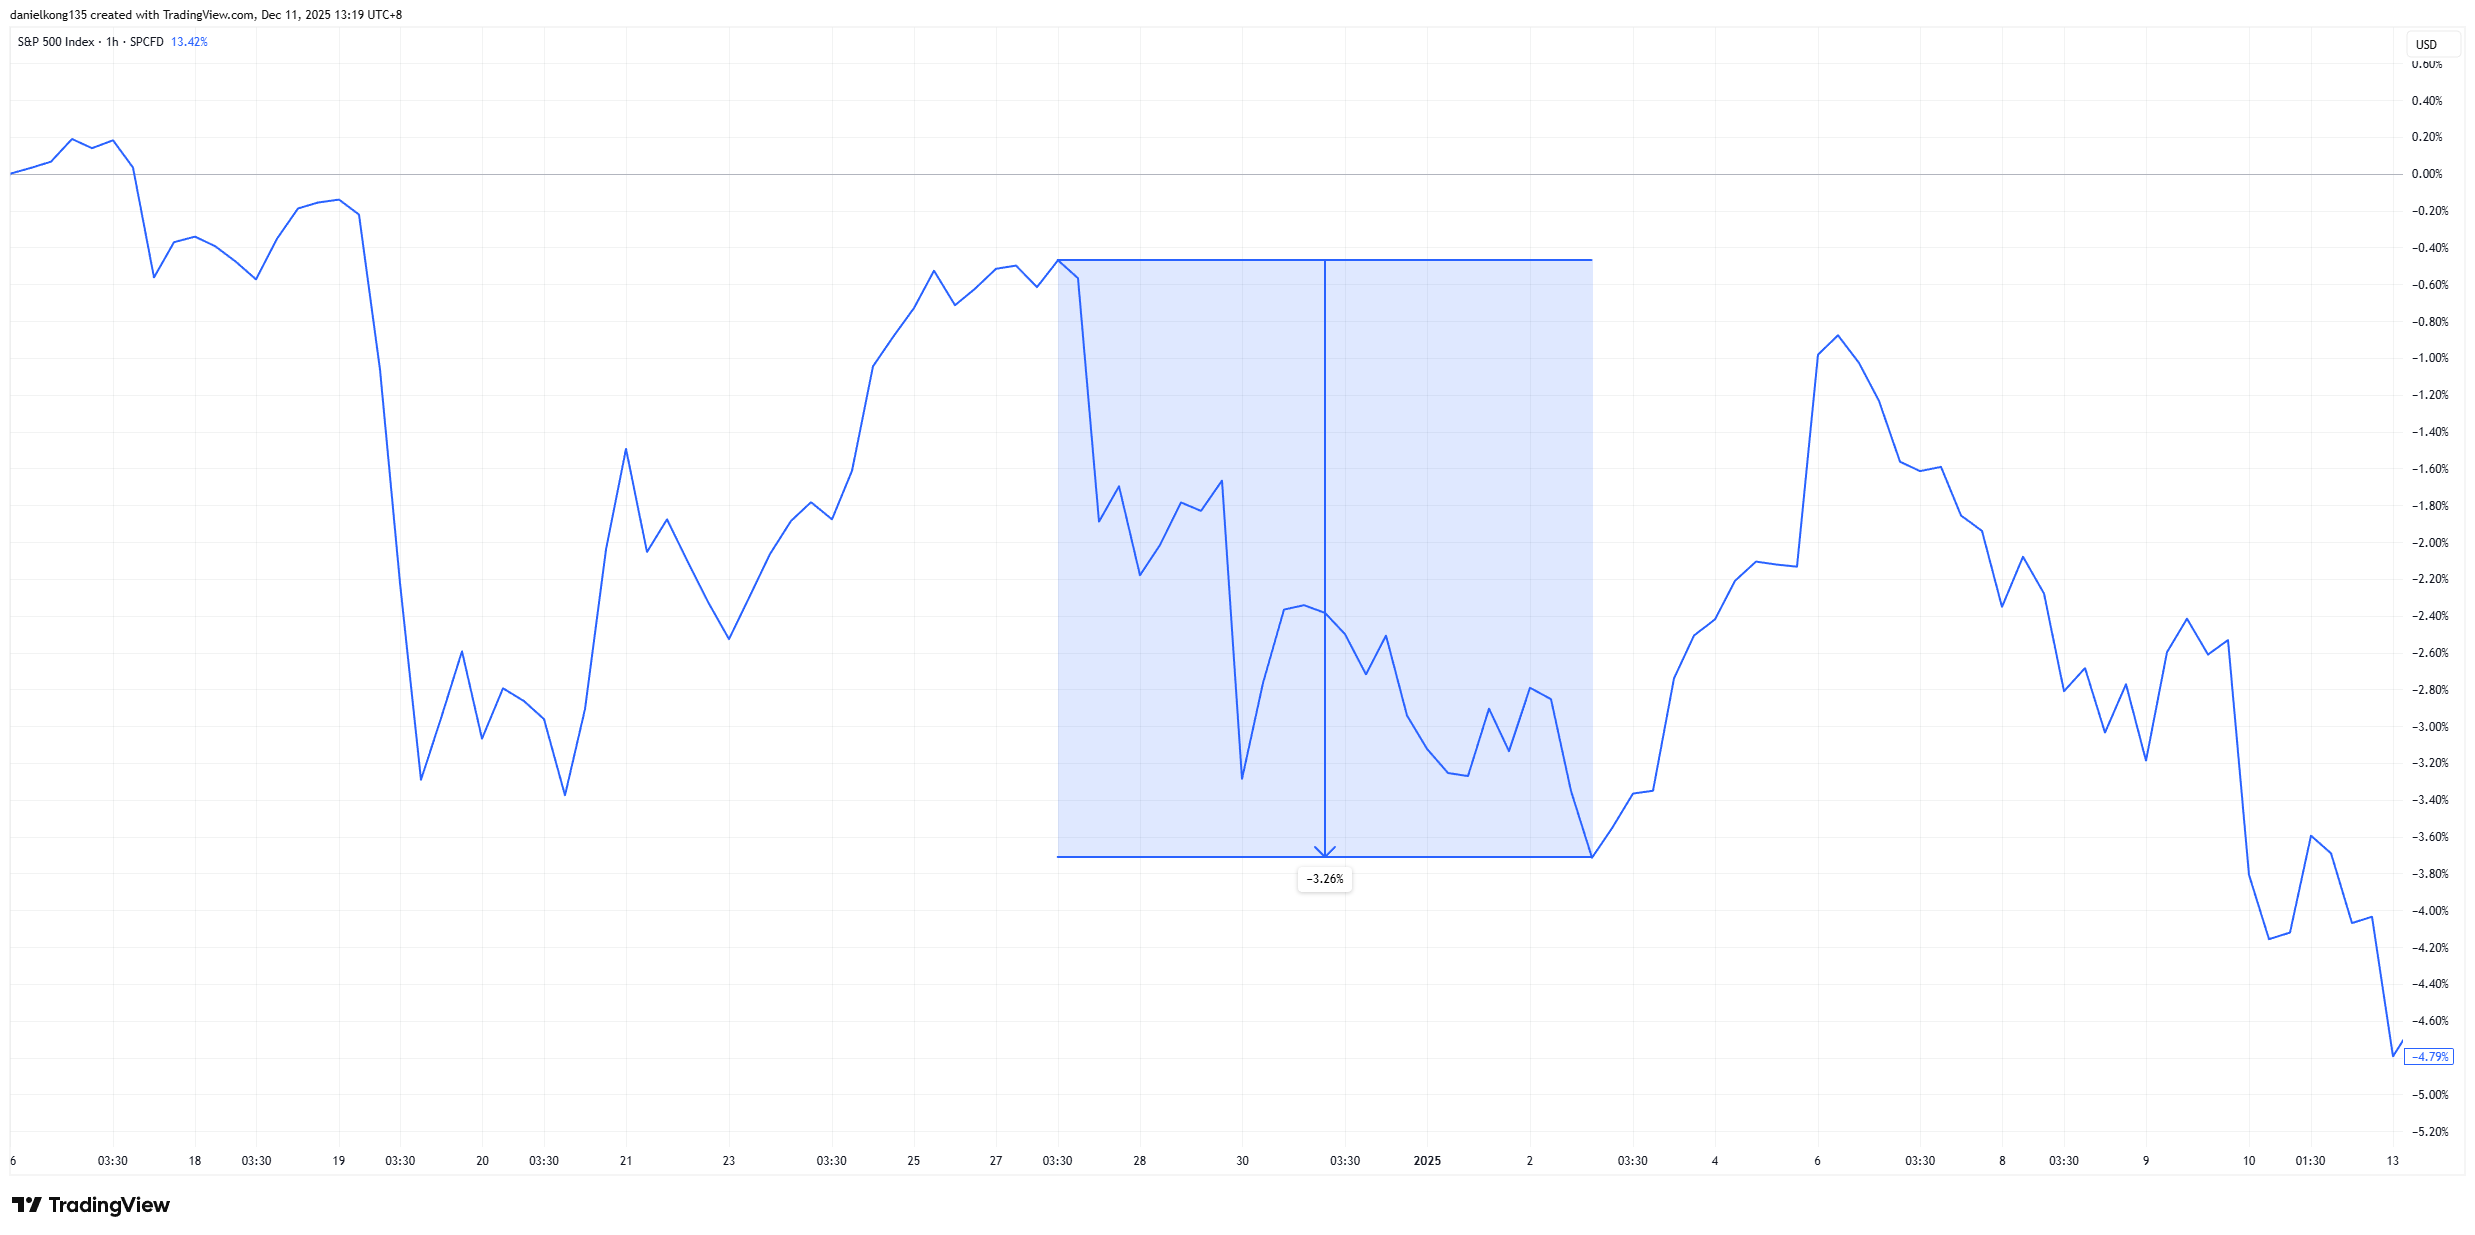
By the traditional definition — the final five trading days of December and the first two trading days of January — the Santa Rally did not occur in 2024. The highlighted portion of the chart shows that the S&P 500 fell by approximately 3.26% across this seven-session window, marking a clear deviation from the long-term seasonal trend in which the period more often delivers gains.
Market commentary also noted that December 2024 became the third monthly decline of the year, reinforcing the shift in tone compared with earlier months. Some analysts described the move as a “reverse Santa Rally,” as selling pressure persisted throughout the final week of the year rather than the typical holiday-period lift.
The chart reflects this behaviour clearly: prices weakened into late December and continued to drift lower through the first sessions of January 2025. Instead of the upward bias historically linked to this period, markets adopted a more defensive posture, influenced by uncertainty around monetary policy, upcoming economic data, and broader sentiment heading into the new year.
This outcome highlights an important point about seasonality: while historical patterns provide useful context, they do not guarantee future performance. Each year’s results depend on the prevailing macroeconomic environment, liquidity conditions, and investor positioning at the time.
Sector Trends and Broader Market Themes
Although December performance varied across sectors, several trends stood out:
- Technology and communication services remained key drivers, supported by ongoing interest in AI-related themes and steady earnings momentum.
- Defensive sectors such as utilities and consumer staples were more mixed, reflecting stable but moderate economic conditions.
- Energy lagged, influenced by softer oil prices toward the end of the month.
Meanwhile, the VIX remained below its long-term average, indicating low volatility and contributing to a more settled environment during the holiday period.
These dynamics helped shape a constructive year-end tone, reinforcing why December continues to attract interest among analysts studying seasonality.
What Could Shape December 2025 Market Behaviour?
As the year draws to a close, analysts often revisit seasonal trends such as the Santa Rally to understand how market patterns might interact with current conditions. While historical data provides useful context, December’s performance can vary depending on several economic, policy, and sentiment-driven factors.
With 2025 moving into its final weeks, a few themes appear particularly relevant in shaping how markets may behave through the remainder of the month.
Policy Signals and the Interest Rate Outlook
Monetary policy remains a central focus for investors each December. Markets continue to assess the Federal Reserve’s updated guidance on interest rates, inflation progress, and growth expectations. Any adjustments in the central bank’s tone — whether signalling prolonged stability or future policy changes — can influence equity sentiment during the final trading weeks of the year.
If inflation continues to move closer to the Fed’s longer-term objective and labour market indicators remain steady, markets may interpret this as supportive for a more settled policy environment. Conversely, unexpected shifts in inflation readings or wage dynamics could create short-term uncertainty.
Economic Indicators Released in December
Several data points released during December tend to attract close attention:
- Non-farm payrolls, which provide insight into employment conditions.
- CPI and PPI inflation readings, which inform policy expectations.
- Manufacturing and services surveys, which offer signals on business momentum.
- Consumer spending patterns, particularly relevant during the holiday season.
While none of these determine market direction on their own, they help shape the narrative that investors carry into the final sessions of the year.
Market Positioning and Sector Dynamics
December often reflects broader positioning trends that have developed throughout the year. For 2025, several themes may continue to influence how markets behave:
- Technology-led momentum, particularly around AI and digital infrastructure.
- Shifts in defensive versus cyclical sectors, depending on economic resilience.
- Global economic conditions, which may affect multinational earnings expectations.
- Portfolio rebalancing, which traditionally features more prominently in late December.
Lower volatility levels can also support a steadier tone, but markets may respond quickly to any unexpected developments or data surprises.
Does the Santa Rally Still Matter Today?
The Santa Rally remains a widely discussed feature of market seasonality, even as the structure of global markets continues to evolve. Investors and analysts frequently revisit the concept each December, not because it predicts outcomes, but because it offers a long-term reference point for understanding how markets have behaved over time.
Why the Santa Rally Still Attracts Attention
Despite changes in technology, trading styles, and macroeconomic conditions, the Santa Rally continues to draw interest for several reasons:
- Historical consistency: The seven-session period has produced positive returns more often than not across multiple decades.
- Clarity of definition: Unlike broader seasonal patterns, the Santa Rally is based on a clearly defined and relatively short window.
- Year-end structure: December naturally contains factors — such as portfolio rebalancing, holiday sentiment, and lower trading volumes — that can create distinctive market behaviour.
- Media and research focus: Renewed coverage each year keeps the concept relevant, reinforcing its place in market discussions.
These elements contribute to its staying power, even if its role is primarily contextual rather than predictive.
Interpreting the Santa Rally in a Modern Market
Today’s market landscape is shaped by several forces that differ from past decades, including algorithmic trading, rapid information dissemination, and greater participation from global investors. These changes can influence how quickly markets respond to new information during the holiday season.
As a result, the Santa Rally is best viewed as a long-term behavioural pattern rather than a rule. It provides an additional reference point when considering December dynamics, complementing — rather than replacing — fundamental and macroeconomic analysis.
Why Seasonality Should Be Treated as One Input Among Many
The Santa Rally highlights how historical patterns can offer context, but market outcomes ultimately depend on broader economic conditions. Factors such as inflation trends, policy signals, corporate earnings, and global developments often play a larger role than seasonal tendencies.
For analysts, this means that the Santa Rally provides a useful framework for understanding typical patterns, but it is not a forecast of future performance. Instead, it serves as a reminder that market psychology and year-end positioning can influence how December unfolds.
Conclusion
Seasonal patterns such as the Santa Rally have become part of the broader conversation around year-end market behaviour. While history shows that the final days of December often display a tendency toward positive returns, each year brings its own economic conditions, policy signals, and shifts in sentiment.
The performance of late 2024, where the S&P 500 did not deliver a Santa Rally, highlighting how seasonal effects can vary depending on the broader market environment. As 2025 progresses and December unfolds, analysts continue to watch how economic data, monetary policy guidance, and broader global developments shape market dynamics during this period.
For those following markets, the Santa Rally serves as a useful reference point — not as a prediction, but as a reminder of how sentiment and positioning can influence trading activity at the end of the year. Understanding these patterns can help frame discussions around market behaviour as investors turn their attention to the coming year.
Frequently Asked Questions
What is the Santa Rally?
The Santa Rally refers to a seasonal pattern in which the US stock market has historically shown a tendency to rise during a specific seven-session window: the final five trading days of December and the first two trading days of January.
This period is often associated with lighter trading volumes, year-end portfolio adjustments, and shifts in investor sentiment. While it has appeared frequently over the decades, the Santa Rally is not guaranteed and varies depending on broader market conditions.
Does the Santa Rally always occur?
No. Although the Santa Rally has occurred in many years and is supported by long-term historical trends, it does not appear every year. Market conditions, economic developments, policy changes, and shifts in sentiment can all influence whether the seven-session window ends with a positive or negative result.
The 2024 period is a recent example of a year in which the Santa Rally did not materialise, demonstrating that seasonal patterns can diverge from expectations.
Why did the Santa Rally fail in 2024?
The Santa Rally did not occur in 2024 because the S&P 500 fell by approximately 3.26% across the seven-session window. Several factors contributed to this outcome:
- Cautious sentiment as investors assessed the economic outlook heading into 2025.
- Uncertainty around policy direction, including interest rate expectations and fiscal priorities under the incoming administration.
- Lower liquidity, typical of holiday trading, which can amplify market movements.
- Broader December weakness, with the month becoming one of the few declines of the year for the index.
The combination of these factors resulted in a “reverse Santa Rally”, where prices softened rather than lifted during the traditional period.
What influences the Santa Rally?
Several factors can influence whether the Santa Rally appears in any given year:
- Liquidity conditions: Trading volumes typically decline during late December, making markets more sensitive to news flow and investor positioning.
- Market sentiment: If economic data is stable and investor confidence is firm, the period may show strength. If sentiment weakens, performance may be subdued.
- Economic releases: Employment data, inflation reports, and business activity surveys published in December can shape expectations for the coming year.
- Policy outlook: Central bank guidance, fiscal discussions, and geopolitical developments may all play a role in influencing risk appetite.
- Portfolio rebalancing: Asset managers often adjust allocations at year-end, which can create short-term flows that affect price action.
These influences can interact in different ways each year, which is why outcomes vary.
Is December still a strong month for equities?
Historically, December has been one of the stronger months for US equities, supported by year-end flows, tax-related positioning, and generally stable sentiment during the holiday period. Long-term market data shows that the month has produced positive average returns more often than not.
However, performance can vary significantly from year to year. Economic conditions, central bank policy, corporate earnings developments, and global events can all influence December outcomes.
The weak performance in December 2024 is an example of how the month can diverge from its historical trend. While seasonality provides useful context, it should be considered alongside broader market factors.
Reference
- “Santa Claus Rally: What It Is and Means for Investors – Investopedia”. https://www.investopedia.com/terms/s/santaclauseffect.asp . Accessed 11 Dec 2025.