Candlestick patterns are the most widely used visual tool in technical analysis. Each formation tells you something specific about the balance between buyers and sellers during a given period — and when they appear in the right context, they can offer an early signal of what may come next.
This guide covers 16 of the most important candlestick patterns across forex, stocks, and commodities — what each one looks like, what it signals, and how traders typically use them. A quick-reference table is included for chart work.
Key Points
- Candlestick patterns are formations made up of one, two, or three candles that traders use to assess potential price reversals and continuations — each pattern has a defined shape, a signal type (bullish or bearish), and a set of conditions that make it more or less reliable.
- No candlestick pattern guarantees a specific outcome; reliability improves significantly when a pattern appears at a key support or resistance level and is confirmed by a follow-up candle or a complementary indicator such as the Relative Strength Index (RSI) or Moving Average Convergence Divergence (MACD).
- The Shooting Star and Inverted Hammer are identical in shape but carry opposite signals — their meaning depends entirely on whether they appear after an uptrend or a downtrend, making trend context the single most important factor when interpreting any candlestick pattern.
16 Candlestick Patterns at a Glance
The table below summarises all 16 candlestick patterns covered in this guide. Use it as a quick reference when analysing charts — full explanations for each pattern follow in the sections below.
| Pattern | Type | Candles | Signal | Confirmation Needed? |
| Hammer | Bullish Reversal | 1 | Buying pressure returns at lows | Yes — next bullish candle |
| Inverse Hammer | Bullish Reversal | 1 | Early buying interest after downtrend | Yes — follow-up candle required |
| Bullish Engulfing | Bullish Reversal | 2 | Decisive shift from sellers to buyers | Strong — rarely needs more |
| Three White Soldiers | Bullish Reversal/Continuation | 3 | Sustained buying momentum | Pattern is self-confirming |
| Piercing Line | Bullish Reversal | 2 | Buying strength entering the market | Watch for follow-through |
| Morning Star | Bullish Reversal | 3 | Weakening sellers; growing buyer confidence | Strong — third candle confirms |
| Marubozu (Bullish) | Bullish Continuation | 1 | Total buyer control during session | Breakout confirmation useful |
| Dragonfly Doji | Bullish Reversal | 1 | Rejection of lower prices | Yes — confirmation candle required |
| Bearish Engulfing | Bearish Reversal | 2 | Strong shift from buyers to sellers | Strong — rarely needs more |
| Evening Star | Bearish Reversal | 3 | Weakening buyers; growing seller confidence | Strong — third candle confirms |
| Hanging Man | Bearish Reversal | 1 | Selling pressure emerging at peak | Yes — next bearish candle |
| Shooting Star | Bearish Reversal | 1 | Buyers rejected at highs; sellers take over | Yes — next candle below body |
| Three Black Crows | Bearish Reversal | 3 | Strong, sustained selling momentum | Pattern is self-confirming |
| Dark Cloud Cover | Bearish Reversal | 2 | Weakening buying; potential downtrend shift | Watch for follow-through |
| Bearish Harami | Bearish Reversal | 2 | Waning buying pressure at the top | Yes — confirmation required |
| Marubozu (Bearish) | Bearish Continuation | 1 | Total seller control during session | Breakout confirmation useful |
Download the Candlestick Patterns PDF here to keep it handy during your chart analysis session.
What Are Candlesticks in Trading?
A candlestick is a visual representation of price movement over a defined period, displaying four key data points in a single chart element: the open, high, low, and close.

The body of the candlestick is the rectangular area between the open and close prices. A green (or white) body means the close was higher than the open — bullish. A red (or black) body means the close was lower than the open — bearish.
The wicks (also called shadows) extend above and below the body to show the session’s high and low. Long wicks often indicate price rejection — the market tested a level but pulled back before the close.
Together, these four points tell a story about the balance between buyers and sellers during that period. Studying groups of candlesticks — and the patterns they form — is the basis of candlestick chart analysis.
How to Read Candlestick Charts?
Interpreting a candlestick chart starts with understanding what individual candles communicate before looking at patterns.
A bullish candle closes above its open, signalling that buyers were in control during that session. A bearish candle closes below its open, indicating selling pressure dominated.
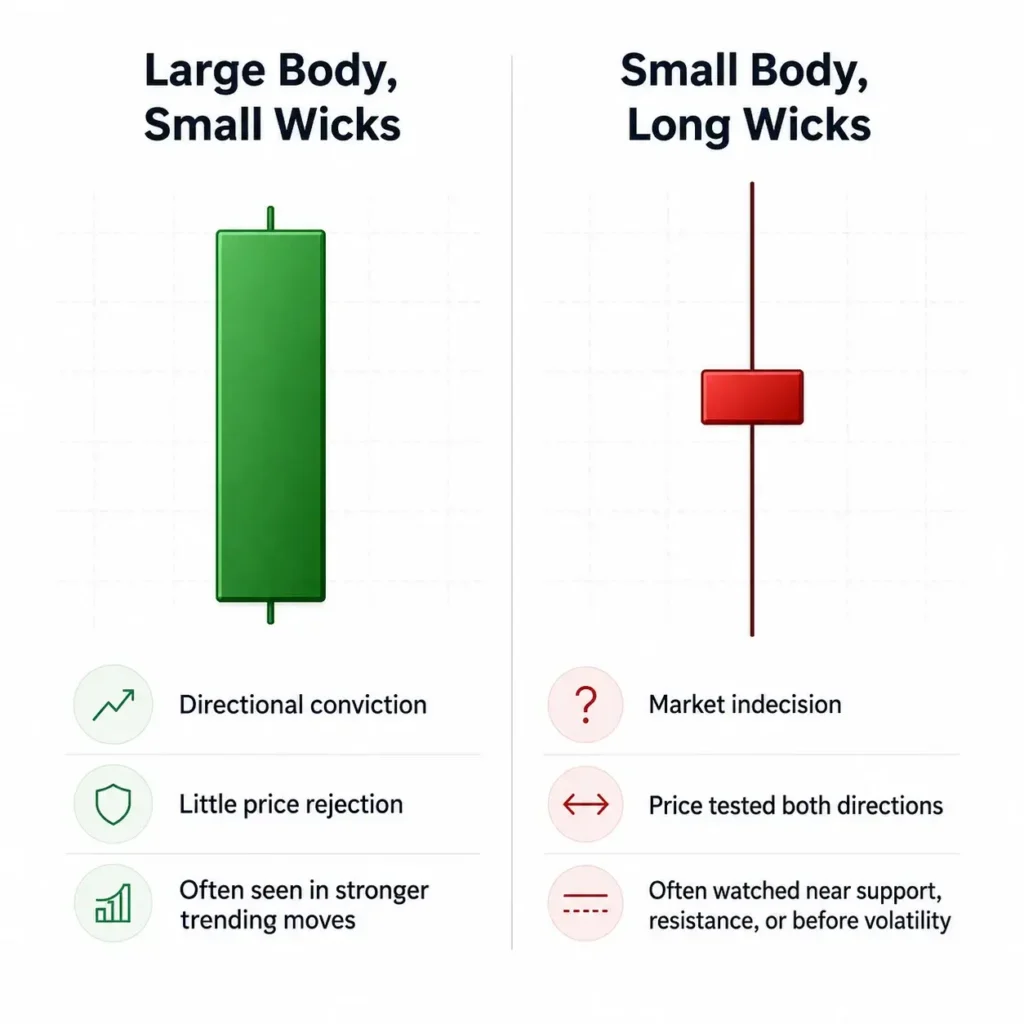
Beyond colour, the size and position of the body and wicks add context. A long body with short wicks often reflects a decisive, one-sided session.
- A short body with long wicks — particularly if the wicks are equal in length — suggests indecision between buyers and sellers. A long lower wick after a downtrend may indicate that sellers pushed the price down but buyers stepped in before the close.
- A long upper wick after an uptrend may suggest the opposite — buyers tried to push higher, but sellers rejected the move.
These individual signals become more meaningful when viewed as part of a multi-candle pattern and when the wider trend context is considered.
Why Use Candlestick Charts?
Candlestick charts are among the most widely used chart types in technical analysis because they pack four pieces of information — open, high, low, and close — into a single, readable visual element. Line charts show only the close; bar charts show all four points but are harder to read quickly.
The visual clarity of candlestick charts makes it easier to spot shifts in market sentiment. A series of green candles followed by a large red candle is immediately visible. A pattern like the Bearish Engulfing — where a small bullish candle is followed by a larger bearish candle that fully covers it — can be identified at a glance, whereas the same information in a line chart would look like a modest pullback.
Candlestick patterns can also provide early signals of potential reversals or continuations before they are confirmed by price alone. This is why they are commonly used alongside other technical indicators rather than in isolation.
Bullish Candlestick Patterns
Bullish candlestick patterns are formations that may signal a potential reversal from a downtrend to an uptrend, or a continuation of upward momentum. They typically indicate growing buying pressure.
Most bullish reversal patterns carry more weight when they appear after a clearly defined downtrend and are confirmed by the following candle or a supporting indicator.
Hammer Candlestick

The Hammer candlestick pattern is a single-candle bullish reversal pattern that forms after a downtrend. It is identified by a small body near the top of the candle’s range and a long lower wick — typically at least twice the length of the body — with little or no upper wick.
The shape reflects a session in which sellers drove the price down significantly during the period, but buyers stepped in and pushed the price back up near the opening level by the close. This rejection of lower prices is seen as an early sign that selling pressure may be weakening.
The Hammer is most meaningful when it appears after a sustained downtrend and forms near a recognisable support level. Some traders wait for the next candle to close bullish before treating the signal as confirmed.
- Appears at the bottom of a downtrend
- Small body near the top of the range; long lower wick
- Signals possible return of buying pressure
- Confirmation: next candle closes higher
- Common mistake: trading the pattern without confirming the downtrend context
Inverse Hammer Candlestick

The Inverse Hammer Candlestick is a single-candle bullish reversal pattern that also forms after a downtrend. Unlike the Hammer, it has a long upper wick and a small body near the bottom of the range, with little or no lower wick.
The long upper wick shows that buyers attempted to push the price higher during the session, but sellers brought it back down before the close. Despite not closing strongly, the pattern can indicate early buying interest — a potential signal that the downtrend may be losing momentum.
Confirmation from the next candle is generally considered important before acting on this pattern, as the session itself ends with sellers still partially in control.
- Occurs after a downtrend
- Small body near the bottom of the range; long upper wick
- Indicates potential early bullish interest
- Confirmation: follow-up candle closes bullish
- Common mistake: treating it as confirmed without a follow-through candle
Bullish Engulfing Candlestick

The Bullish Engulfing Candlestick pattern is a two-candle bullish reversal formation. It consists of a small bearish candle followed by a larger bullish candle whose body completely covers — or ‘engulfs’ — the body of the first candle.
This pattern suggests a decisive shift from selling to buying pressure. The first candle shows continued bearish momentum; the second shows that buyers have stepped in forcefully enough to erase the previous session’s losses and close meaningfully higher.
The Bullish Engulfing is generally considered a notable multi-candle pattern compared with single-candle patterns like the Hammer, because the second candle itself provides a degree of confirmation. It remains more reliable when it appears after a clear downtrend and near a support level.
- Two-candle reversal pattern; second candle’s body fully engulfs the first
- Appears after a downtrend
- Signals a strong shift in market sentiment from bearish to bullish
- The larger the second candle, the stronger the signal
- Common mistake: treating partial engulfment as a valid pattern
Three White Soldiers Candlestick

The Three White Soldiers Candlestick pattern consists of three consecutive bullish candles, each closing higher than the previous and opening within or near the previous candle’s body.
The pattern suggests sustained buying pressure over multiple sessions and is widely viewed as a commonly referenced bullish candlestick pattern, particularly when each candle has a relatively long body and short wicks. It can signal either a reversal from a downtrend or the continuation of existing bullish momentum.
One caveat is that the pattern can occasionally appear after an extended rally, at which point it may reflect exhaustion rather than continued momentum. Looking at the broader trend context and checking for overbought readings on indicators like the RSI may help assess the signal’s reliability.
- Three consecutive bullish candles, each closing higher
- Short wicks indicate strong, sustained buying
- Signals potential trend reversal or continuation
- Often more meaningful after a clear prior downtrend
- Common mistake: ignoring whether the pattern appears after an already extended rally
Piercing Line Candlestick
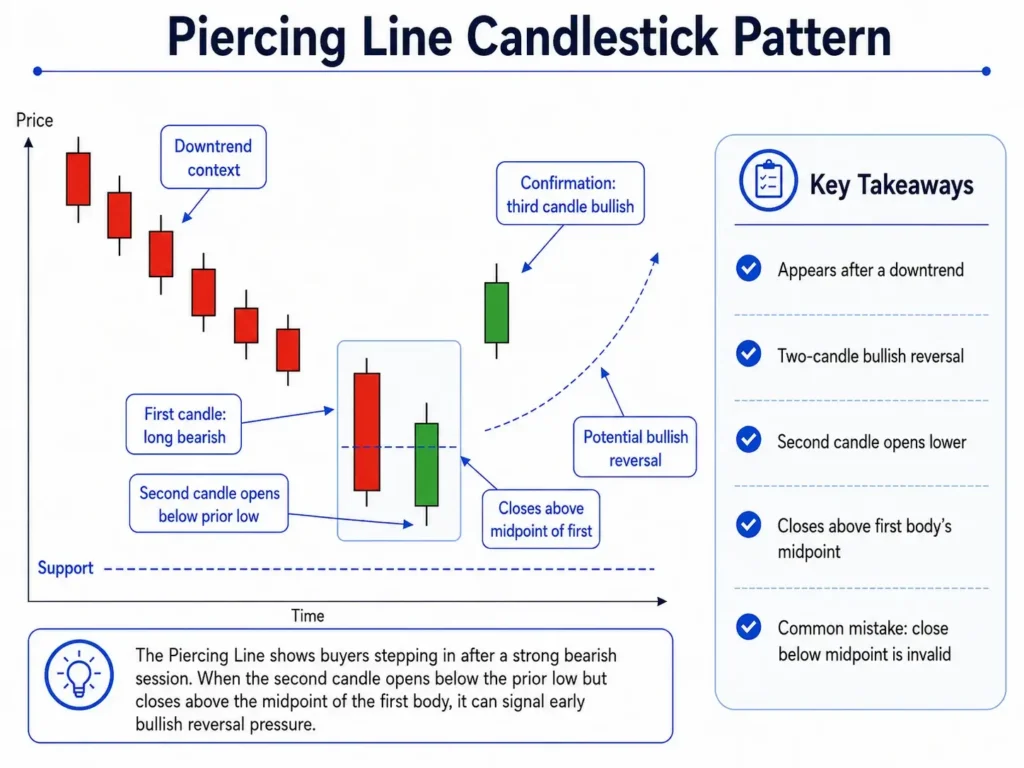
The Piercing Line Candlestick is a two-candle bullish reversal pattern. It begins with a long bearish candle, followed by a bullish candle that opens below the previous session’s low but closes above the midpoint of the first candle’s body.
The key requirement is that the second candle closes more than halfway into the first candle’s body. This shows that buyers absorbed the initial selling pressure and pushed the price back up significantly, suggesting a potential shift in momentum.
The Piercing Line is generally regarded as a less prominent signal than the Bullish Engulfing, because the second candle does not fully cover the first. Additional confirmation from the next candle or a supporting indicator is often used to validate the pattern.
- Two-candle pattern; second candle opens lower but closes above the midpoint of the first
- Signals early buying strength entering after a price drop
- Confirmation: watch for a third bullish candle
- Common mistake: accepting a close below the midpoint as a valid signal
Morning Star Candlestick

The Morning Star Candlestick is a three-candle bullish reversal pattern. It begins with a long bearish candle, followed by a small-bodied candle — often a Doji or near-Doji — that gaps away from the first candle, and is completed by a long bullish candle that closes well into the first candle’s range.
The small middle candle represents indecision or a pause in selling momentum. The third candle confirms that buyers have regained control. Together, the sequence suggests that a downtrend is losing steam and a potential reversal is underway.
The gap between the first and second candle, and between the second and third candle, strengthens the pattern — though in markets that trade continuously (such as forex), strict gaps are less common and small-bodied middle candles are still treated as valid.
- Three-candle reversal pattern forming after a downtrend
- Middle candle is small-bodied, signalling indecision
- Third candle closes bullishly, confirming the reversal
- Gaps between candles add signal strength where present
- Common mistake: treating a weak or non-confirming third candle as sufficient
Marubozu (Bullish) Candlestick

A Bullish Marubozu Candlestick is a single candle with no upper or lower wicks — the price opened at the session’s low and closed at the session’s high.
This pattern reflects strong buyer control throughout the session, with no meaningful pullback at any point. It is often seen as a sign of continued bullish momentum and is commonly associated with breakout moves.
Because the pattern already reflects strong directional commitment from buyers, some traders treat it as self-confirming. However, like all single-candle patterns, it is generally more reliable in the context of a broader trend or near a key level.
- No wicks; solid bullish body opening at the low and closing at the high
- Signals total buyer control throughout the session
- Common in breakout or momentum scenarios
- Useful for confirming the direction of existing trends
- Common mistake: entering a position at the close without considering risk-to-reward
Doji Candlestick

A Doji Candlestick is a single-candle pattern in which the open and close prices are virtually identical, resulting in a very small or non-existent body. The wicks can extend in either direction, reflecting price movement during the session that ultimately returned to the opening level.
The Doji signals market indecision — neither buyers nor sellers were able to take decisive control during the period. In the context of an established trend, a Doji can indicate that momentum is weakening and a reversal may be approaching. It is most meaningful when it appears after a clear directional move and is followed by a confirming candle in the opposite direction.
There are several common Doji variants, each with a slightly different signal. The Dragonfly Doji (long lower wick, no upper wick) suggests rejection of lower prices and a possible bullish reversal. The Gravestone Doji (long upper wick, no lower wick) suggests rejection of higher prices and a possible bearish reversal. The standard Doji — with roughly equal wicks in both directions — is the most neutral of the three.
- Open and close at or near the same price level — minimal body
- Signals market indecision; meaningful in the context of a preceding trend
- Three main variants: standard Doji, Dragonfly Doji (bullish lean), Gravestone Doji (bearish lean)
- Confirmation: direction of the following candle determines the likely signal
- Common mistake: treating a Doji as a standalone signal without checking the preceding trend
Dragonfly Doji Candlestick

The Dragonfly Doji Candlestick is a single-candle pattern in which the open, close, and high prices are all at or near the same level, while a long lower wick extends downward.
The shape indicates that sellers pushed the price significantly lower during the session, but buyers stepped in and drove it back up to the opening level by the close. This rejection of lower prices can signal a potential bullish reversal when the pattern appears after a downtrend.
A confirmation candle is generally considered necessary, as the Dragonfly Doji alone shows indecision rather than a decisive shift. The longer the lower wick relative to the session range, the stronger the implied rejection.
- Long lower wick; open, close, and high at or near the same level
- Signals rejection of lower prices and potential buyer re-entry
- Confirmation: a bullish candle following the Doji
- More meaningful when it appears after a sustained downtrend
- Common mistake: confusing it with a Hammer — the Dragonfly Doji has a near-zero body
Bearish Candlestick Patterns
Bearish candlestick patterns suggest a potential shift from an uptrend to a downtrend, or a continuation of downward price movement. They typically indicate growing selling pressure or buyer exhaustion. Bearish reversal patterns are generally most meaningful when they appear at the top of a clear uptrend, near resistance levels, and are confirmed by a follow-up candle or indicator.
Bearish Engulfing Candlestick

The Bearish Engulfing Candlestick pattern is a two-candle bearish reversal formation. It appears after an uptrend and consists of a small bullish candle followed by a larger bearish candle whose body completely covers the body of the first.
The pattern signals a decisive shift in momentum — buyers were still in control during the first session, but sellers overwhelmed them in the second, driving the price down enough to fully erase the previous candle’s gains. The larger the bearish candle relative to the first, the stronger the implied momentum shift.
- Appears after an uptrend; bearish candle fully engulfs the prior bullish body
- Signals a strong shift from buying to selling pressure
- More reliable near resistance levels
- Common mistake: treating partial engulfment as a valid signal
Evening Star Candlestick

The Evening Star Candlestick is a three-candle bearish reversal pattern that forms at the top of an uptrend. It begins with a long bullish candle, followed by a small-bodied candle signalling indecision, and is completed by a long bearish candle that closes well into the first candle’s range.
The Evening Star is the bearish counterpart to the Morning Star. The middle candle reflects a pause or hesitation in buying momentum. The third candle confirms that sellers have taken over. The pattern signals that the uptrend may be losing strength and a reversal could follow.
Note: The Evening Star is sometimes confused with the Morning Star. The key distinction is trend context — the Morning Star appears after a downtrend (bullish reversal), while the Evening Star appears after an uptrend (bearish reversal).
- Three-candle bearish reversal pattern forming after an uptrend
- Middle candle is small-bodied, signalling buyer hesitation
- Third candle closes bearishly, confirming seller control
- Confirmation: price continues lower after the third candle
- Common mistake: confusing it with the Morning Star — trend direction determines which pattern applies
Hanging Man Candlestick

The Hanging Man Candlestick is a single-candle bearish reversal pattern that forms at the top of an uptrend. It looks identical to the Hammer but appears in the opposite trend context — a small body near the top of the range and a long lower wick.
Despite closing near its high, the long lower wick shows that selling pressure emerged during the session. Buyers managed to push the price back up before the close, but the intra-session sell-off suggests that bears are starting to test the uptrend.
The Hanging Man is often treated as a warning signal rather than a firm reversal confirmation. A bearish follow-up candle is typically used to confirm the pattern before drawing conclusions.
- Forms after a price rise; small body near the top; long lower wick
- Signals emerging selling pressure at market peaks
- Visually identical to the Hammer — trend direction is the differentiator
- Confirmation: next candle closes lower, ideally with a gap down
- Common mistake: confusing it with the Hammer by ignoring the trend context
Shooting Star Candlestick

The Shooting Star Candlestick is a single-candle bearish reversal pattern that forms after an uptrend. It has a small body near the bottom of the candle’s range, a long upper wick — typically at least twice the length of the body — and little or no lower wick.
The pattern reflects a session in which buyers pushed the price substantially higher, but sellers stepped in and drove it back down to near the opening level before the close. The failed attempt to hold higher prices is seen as a potential sign of buyer exhaustion and may indicate that a reversal could follow.
The Shooting Star pattern is generally more meaningful when it appears at or near a prior resistance level, after an extended rally, or when it forms on a higher timeframe. Confirmation typically comes from the next candle closing below the Shooting Star’s body, though some traders also look for RSI divergence or a bearish MACD cross to strengthen the case.
- Appears after an uptrend
- Small body near the bottom of the range; long upper wick
- Signals possible rejection of higher prices
- Confirmation: next candle closes lower
- Common mistake: treating it as a reversal signal without checking the trend context
Three Black Crows Candlestick

The Three Black Crows pattern consists of three consecutive long bearish candles, each closing lower than the previous and opening within or near the previous candle’s body.
The pattern suggests sustained, broad-based selling pressure over multiple sessions and is widely viewed as a strong bearish signal — particularly when it appears after an uptrend or at a prior resistance level. Each candle typically has a relatively long body with short wicks, indicating that sellers remained in control throughout each session with little buyer pushback.
- Three consecutive bearish candles, each closing lower
- Short wicks indicate strong, sustained selling
- Signals a potential reversal of bullish trend or continuation of bearish momentum
- Common mistake: acting on the pattern after an already extended decline
Dark Cloud Cover Candlestick

The Dark Cloud Cover Candlestick is a two-candle bearish reversal pattern. It begins with a strong bullish candle, followed by a bearish candle that opens above the prior session’s high but closes below the midpoint of the first candle’s body.
The opening gap upward creates the illusion of continued bullish momentum, but the close below the midpoint signals that sellers have taken control. The pattern suggests that the uptrend may be running out of fuel.
- Two-candle pattern; bearish candle opens above the prior high but closes below the midpoint
- Appears after an uptrend
- The deeper the close into the first candle’s body, the stronger the signal
- Common mistake: accepting a close above the midpoint as a valid Dark Cloud Cover
Bearish Harami Candlestick

The Bearish Harami Candlestick is a two-candle pattern in which a large bullish candle is followed by a smaller bearish candle whose body is entirely contained within the body of the first.
The name ‘harami’ comes from the Japanese word for pregnant — the smaller second candle is visually contained within the larger first. The pattern reflects waning buying pressure and potential hesitation at market tops.
The Bearish Harami is generally considered a weaker bearish signal than the Bearish Engulfing and typically requires additional confirmation before being acted upon.
- Small bearish candle fully inside the prior bullish candle’s body
- Indicates weakening bullish momentum
- Confirmation strongly recommended before treating as a reversal signal
- Common mistake: treating a Bearish Harami as equivalent in strength to a Bearish Engulfing
Marubozu (Bearish) Candlestick

A Bearish Marubozu Candlestick is a single candle with no upper or lower wicks — the price opened at the session’s high and closed at the session’s low.
The pattern reflects strong seller control throughout the session, with no meaningful buyer pushback at any point. It is often seen as a sign of continued bearish momentum and is commonly associated with breakdowns or strong trend days to the downside.
- No wicks; solid bearish body opening at the high and closing at the low
- Signals total seller control throughout the session
- Common in breakdown or momentum scenarios
- Common mistake: entering a short position at the close without considering support levels nearby
How to Confirm Candlestick Patterns
Candlestick patterns can suggest a possible change in price behaviour, but they do not guarantee the next move. This is why traders often look for confirmation from price action, volume, or momentum indicators before placing more weight on a pattern.
Common confirmation methods include:
- Follow-Up Candle: A bullish pattern may be confirmed when the next candle closes higher. A bearish pattern may be confirmed when the next candle closes lower, especially below the pattern’s body.
- Volume: Higher-than-average volume can suggest stronger market participation behind the move. This is often useful for larger patterns such as Bullish Engulfing or Bearish Engulfing.
- Relative Strength Index (RSI): RSI can help show whether a market is overbought or oversold. For example, a bearish reversal pattern appearing when RSI is above 70 may carry more weight, while a bullish reversal pattern near an RSI below 30 may suggest stronger buying interest [1].
- Moving Average Convergence Divergence (MACD): A bullish or bearish MACD crossover that appears near a candlestick pattern may support the case for a potential change in momentum.
No confirmation method removes the risk of false signals. Candlestick patterns are usually more useful when assessed together with broader market structure, support and resistance levels, and current market conditions.
Related Article: 3 Commonly Used Indicators on TradingView
Forex Candlestick Patterns
Candlestick patterns are widely used in forex trading because the market runs almost 24 hours a day during the trading week. This creates a more continuous price chart, where price gaps are less common than in markets with fixed opening and closing hours.
On forex CFD charts, patterns such as the Morning Star and Evening Star may still appear without strict gaps between candles. In these cases, traders often focus on the overall candle structure, trend context, and confirmation from the next candle.
Major forex pairs such as EUR/USD, GBP/USD, USD/JPY, and AUD/USD usually have higher liquidity, which may help produce clearer candlestick formations. However, no pattern should be treated as a guaranteed signal.
Common forex candlestick patterns include:
- Doji: Reflects market indecision, often before major economic releases.
- Engulfing Patterns: May suggest a shift in buying or selling pressure near key levels.
- Hammer and Shooting Star: Often used to assess potential turning points after strong moves.
- Morning Star and Evening Star: May indicate a possible change in momentum.
Timeframe and market conditions also matter. Candlestick patterns on daily and 4-hour charts generally carry more weight than those on very short timeframes, where short-term noise and spread movements can affect the signal.
In short, candlestick patterns can support forex trading strategies, but they should be read alongside trend direction, support and resistance, confirmation signals, and forex risk management.
Are Candlestick Patterns Reliable for CFD Trading?
Candlestick patterns can be used in CFD trading across markets such as forex, indices, shares, and commodities. Since CFD prices are based on underlying markets, the same pattern logic applies. For example, a Bearish Engulfing pattern on a CFD chart carries the same technical meaning as it would on a share or spot market chart.
However, their reliability depends on market conditions, timeframe, liquidity, and risk controls. Key points to consider:
- Leverage increases risk: Candlestick patterns do not change because of leverage, but losses can be larger if the signal fails.
- Confirmation matters: Traders often look for follow-up candles, support and resistance levels, or volume before placing weight on a pattern.
- Higher timeframes tend to be clearer: Daily, 4-hour, and weekly charts usually provide stronger signals than very short timeframes.
- Liquidity affects signal quality: Major forex pairs, gold, crude oil, and key indices may produce cleaner patterns than less liquid markets.
- Gaps can affect patterns: Share CFDs and index CFDs may gap between market close and open, which can support or invalidate a pattern.
- Patterns are not predictions: They reflect past price behaviour and should not be treated as a guaranteed signal of future market movement.
In short, candlestick patterns can be useful in CFD analysis, but they work best when used with confirmation, suitable timeframes, and clear risk awareness. They should be viewed as one part of technical analysis rather than a standalone decision-making tool.
Candlestick Analysis Tools on Vantage
Identifying candlestick patterns manually across multiple instruments and timeframes is time-intensive. Vantage offers several platform tools that may assist traders in their chart analysis.
Technical Insights
The Technical Insights feature available through Vantage provides automated, real-time analysis of key chart patterns across major and minor forex pairs as well as popular commodities. The tool identifies price action signals — including potential breakouts, trend reversals, and continuation patterns — and presents them with visual overlays and historical context.


Featured Idea
The Featured Idea tool presents curated trading concepts built on technical and fundamental analysis. Ideas are often illustrated through candlestick charts, giving traders a visual reference for how a pattern or setup has developed on a specific instrument. Traders can filter ideas by forex pair and analysis style.

Analyst View
The Analyst View feature offers structured trading insights by combining quantitative models with technical analysis. It presents information through defined trendlines, support and resistance levels, and candlestick chart references across a broad range of instruments.

These tools are designed to support chart analysis and do not guarantee trading outcomes. Traders should consider any tool-generated signal within the broader context of their own analysis and risk management approach.
Using Candlestick Patterns in Your Trading Analysis
Candlestick patterns are most useful when read as part of a wider analysis process, rather than as standalone signals. The key question is not just what pattern appears, but where it appears, what trend came before it, and whether the next candle confirms the signal.
For example, a Bullish Engulfing pattern forming in the middle of a sideways EUR/USD chart carries less weight than the same pattern appearing near a clear support level after a sustained downtrend. The structure may be the same, but the market context is different.
Tools such as Vantage Technical Insights can help identify candlestick patterns across multiple instruments, but the final interpretation still depends on trend direction, key price levels, and confirmation from indicators such as the Relative Strength Index (RSI) or Moving Average Convergence Divergence (MACD).
Candlestick patterns should be viewed as probability-based tools, not predictions. They can support trading analysis, but they cannot remove uncertainty, and past performance is not a reliable indicator of future results.
FAQ
What are candlestick patterns?
Candlestick patterns are formations made up of one, two, or three candlesticks on a price chart that traders use to assess potential shifts in market momentum. Each pattern has a defined shape, a signal type (typically bullish or bearish), and a set of contextual conditions that make it more or less meaningful. They are used across forex, stocks, indices, and commodities to identify potential reversal and continuation scenarios in price action.
How many candlestick patterns are there?
There is no definitive count, but the most commonly cited figure is between 40 and 75 recognised candlestick patterns in technical analysis. Of these, most active traders focus on a core set of 15 to 20 formations that appear frequently and have well-understood signal characteristics.
The 16 patterns covered in this guide represent the most widely used subset — learning these provides a solid foundation before exploring more complex or less common formations.
Are candlestick patterns reliable?
Candlestick patterns are not independently reliable in the sense of predicting a specific outcome with certainty — no technical pattern is. Their reliability improves when a pattern appears at a key support or resistance level, is confirmed by a follow-up candle, and is supported by a complementary indicator such as RSI or MACD.
Single-candle patterns such as the Hammer or Shooting Star tend to produce more false signals than multi-candle patterns like the Bullish Engulfing or Three White Soldiers, which contain a degree of built-in confirmation. Past performance of any pattern is not a reliable indicator of future results.
Do candlestick patterns work?
Candlestick patterns work in the sense that they reflect real information about the balance between buyers and sellers during a given period. A Bearish Engulfing, for example, shows that sellers took control decisively enough to erase the previous session’s gains — that is a fact about price action, not a prediction.
Whether a pattern leads to the expected follow-through depends on many factors: the broader trend, the level at which it forms, market conditions at the time, and whether the signal is confirmed. Candlestick patterns are best understood as probabilistic tools that improve decision-making when used in context, not as automatic entry or exit signals.
How do candlestick patterns work?
Candlestick patterns work by capturing the relationship between the open, high, low, and close prices across one or more sessions. The shape of each candlestick — and the sequence of candles in a pattern — reflects the relative strength of buyers and sellers during that period.
For example, a Bullish Engulfing pattern shows that buyers overwhelmed sellers so decisively that the second candle fully covered the first, suggesting a shift in momentum. Traders use these visual signals as part of a broader technical analysis process, typically combining them with trend context, support and resistance levels, and indicator confirmation.
What is a shooting star candlestick pattern?
A Shooting Star candlestick pattern is a single-candle bearish reversal signal that appears after an uptrend. It is characterised by a small body near the bottom of the session’s range, a long upper wick at least twice the body’s length, and little or no lower wick.
The pattern forms when buyers push the price up significantly during the session but sellers step in and drive it back down near the opening level before the close. It is considered most reliable when it appears near a prior resistance level and is confirmed by a bearish follow-up candle.
Risk Warning: CFDs are complex financial instruments and carry a high risk of losing money rapidly due to leverage. You should ensure you fully understand the risks involved and carefully consider whether you can afford to take the high risk of losing your money before trading.
Disclaimer: The information is provided for educational purposes only and doesn’t take into account your personal objectives, financial circumstances, or needs. It does not constitute investment advice. We encourage you to seek independent advice if necessary. No representation or warranty is given as to the accuracy or completeness of any information contained within. This material may contain historical or past performance figures and should not be relied on. Furthermore estimates, forward-looking statements, and forecasts cannot be guaranteed. The information on this site and the products and services offered are not intended for distribution to any person in any country or jurisdiction where such distribution or use would be contrary to local law or regulation.
Reference
- “Relative Strength Index (RSI) – Fidelity” https://www.fidelity.com/learning-center/trading-investing/technical-analysis/technical-indicator-guide/RSI Accessed 26 May 2026