In market terminology, a bullish market is one where prices are rising and investor confidence is high; a bearish market is one where prices are falling and pessimism dominates. These two states describe the prevailing direction and sentiment of any financial market — from stock indices and forex pairs to commodities and cryptocurrencies.
Traders and investors encounter these terms constantly. Understanding what each means, how to identify them through technical and fundamental analysis, and how each market phase affects trading behaviour forms a core part of market literacy — whether you are beginning to trade or refining an existing strategy.
Past performance and historical examples are not reliable indicators of future performance. This article explains the definitions of bullish and bearish markets, how to identify each phase using technical and fundamental indicators, real-world examples and what each market condition means for trading decisions.
Key Points
- A bullish market is defined by rising asset prices, strong investor confidence, and expanding economic indicators such as GDP growth and low unemployment. A bearish market shows the opposite: falling prices, heightened pessimism, and weakening fundamentals — typically confirmed when prices decline 20% or more from recent highs.
- Traders identify bullish and bearish conditions using a combination of technical indicators — including moving averages (golden cross and death cross patterns), RSI, and MACD — alongside fundamental data and sentiment tools such as the VIX volatility index.
- Recognising which market phase is underway helps traders adapt their positioning: momentum and long-biased strategies suit bullish conditions, while capital preservation, hedging, and rotation into defensive assets are typically more appropriate in bearish phases.
What Does Bullish Mean?
The term “bullish” originates from the image of a charging bull — one that attacks by thrusting its horns upward. That upward motion became a metaphor for rising prices and forward momentum in financial markets. The equivalent “bearish” comes from the bear’s opposite attack: swiping its paws downward, representing falling prices.
A bullish market is one where prices chart an upward trend over time, translating to capital gains for long position holders. During bull markets, investors tend to be optimistic, as growing asset prices inflate their portfolio values.
There is a prevailing belief that the economy and corporate earnings will continue to grow, increasing investor confidence. This confidence further fuels demand for stocks and shares as more investors enter the market, pushing prices even higher.
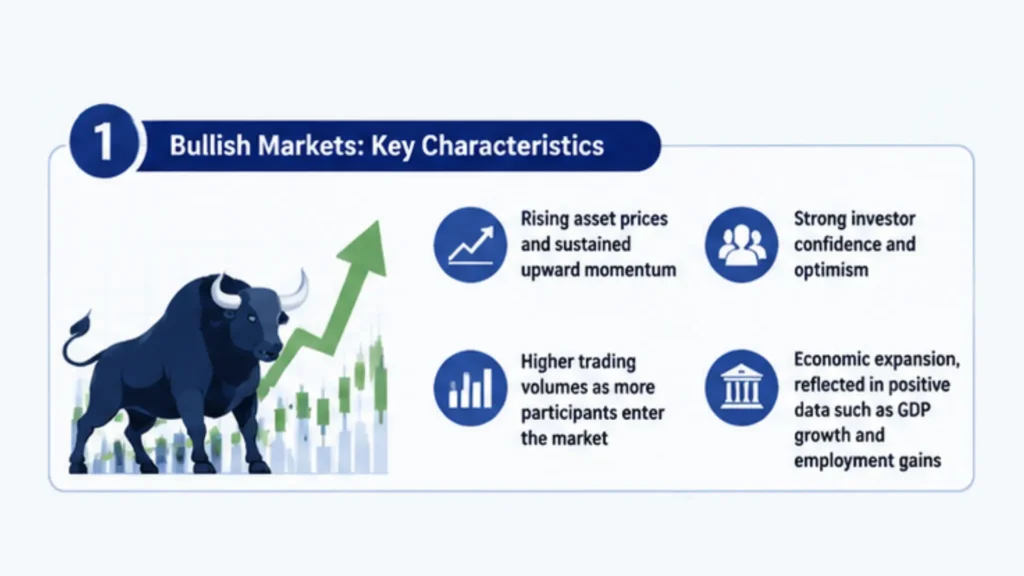
Bullish markets can be identified by these four key characteristics:
- Rising asset prices and sustained upward momentum
- Strong investor confidence and optimism
- Higher trading volumes as more participants enter the market
- Economic expansion, reflected in positive data such as GDP growth and employment gains
Traders also describe the degree of their bullish conviction using qualifying terms.
- A strongly bullish view implies high confidence in a significant price advance — a trader holding this view typically takes a larger long position and maintains it through short-term pullbacks, confident in the underlying trend.
- A mildly bullish view reflects more moderate optimism, often expressed through smaller or more defensive positioning.
These distinctions matter when reading analyst commentary or broker research, where “strongly bullish” carries specific implications about the size and conviction of a position.
Technical Indicators of Bullish Sentiment
On the charts, a bullish market is often accompanied by clear technical patterns that point to upward momentum and strengthening investor confidence. Traders rely on these signals to confirm that buying pressure is outpacing selling pressure.
1. Higher highs and higher lows
One of the clearest technical signs of a bullish trend is a price chart that consistently makes higher highs and higher lows. This pattern shows that buyers are willing to pay increasingly higher prices, and sellers are closing trades at higher lows — both strong signals of positive momentum.
2. Moving averages trending upward
Moving averages (MAs) are technical indicators that smooth out price data over a specified time range, dampening market noise to more clearly indicate price trends.
When the market is in a bullish phase:
- The short-term moving averages (such as the 50-day MA) typically rise above the long-term averages (such as the 200-day MA).
- This crossover, known as a golden cross, is a classic technical confirmation of a sustained uptrend.
- The slope of both moving averages tilting upward also reinforces bullish momentum.
3. Trading volume builds as prices rise
Volume tells traders how much conviction lies behind a price move. In a healthy bull market, rising prices are usually accompanied by increasing trading volume, which suggests strong participation from investors. When prices rise on low volume, it may indicate a weaker or short-lived rally.
4. Relative Strength Index (RSI) above mid-range
The RSI, a momentum oscillator that ranges from 0 to 100, often stays in the 60–80 range during a bullish market. This shows that buying momentum is dominant but not yet at an extreme. A sustained RSI above 50 is generally viewed as confirmation of bullish sentiment.
5. Positive MACD crossover
The Moving Average Convergence Divergence (MACD) indicator measures the difference between short-term and long-term momentum. When the MACD line crosses above its signal line, it often signals the start of a bullish phase. A rising histogram and MACD values above zero further confirm strengthening upward momentum.
6. Breakouts above resistance
In bullish conditions, prices often break through key resistance levels — price points that previously capped upward movement. When confirmed, a breakout to higher prices — especially on strong volume — may indicate strengthening momentum and can be interpreted by some traders as a continuation signal.
Together, these technical indicators help traders identify and confirm the strength of a bullish market trend. While no single signal guarantees continued gains, observing several of these patterns together often suggests that market sentiment is positive and that the upward move has strong momentum behind it.
A Recent Example of a Bullish Market
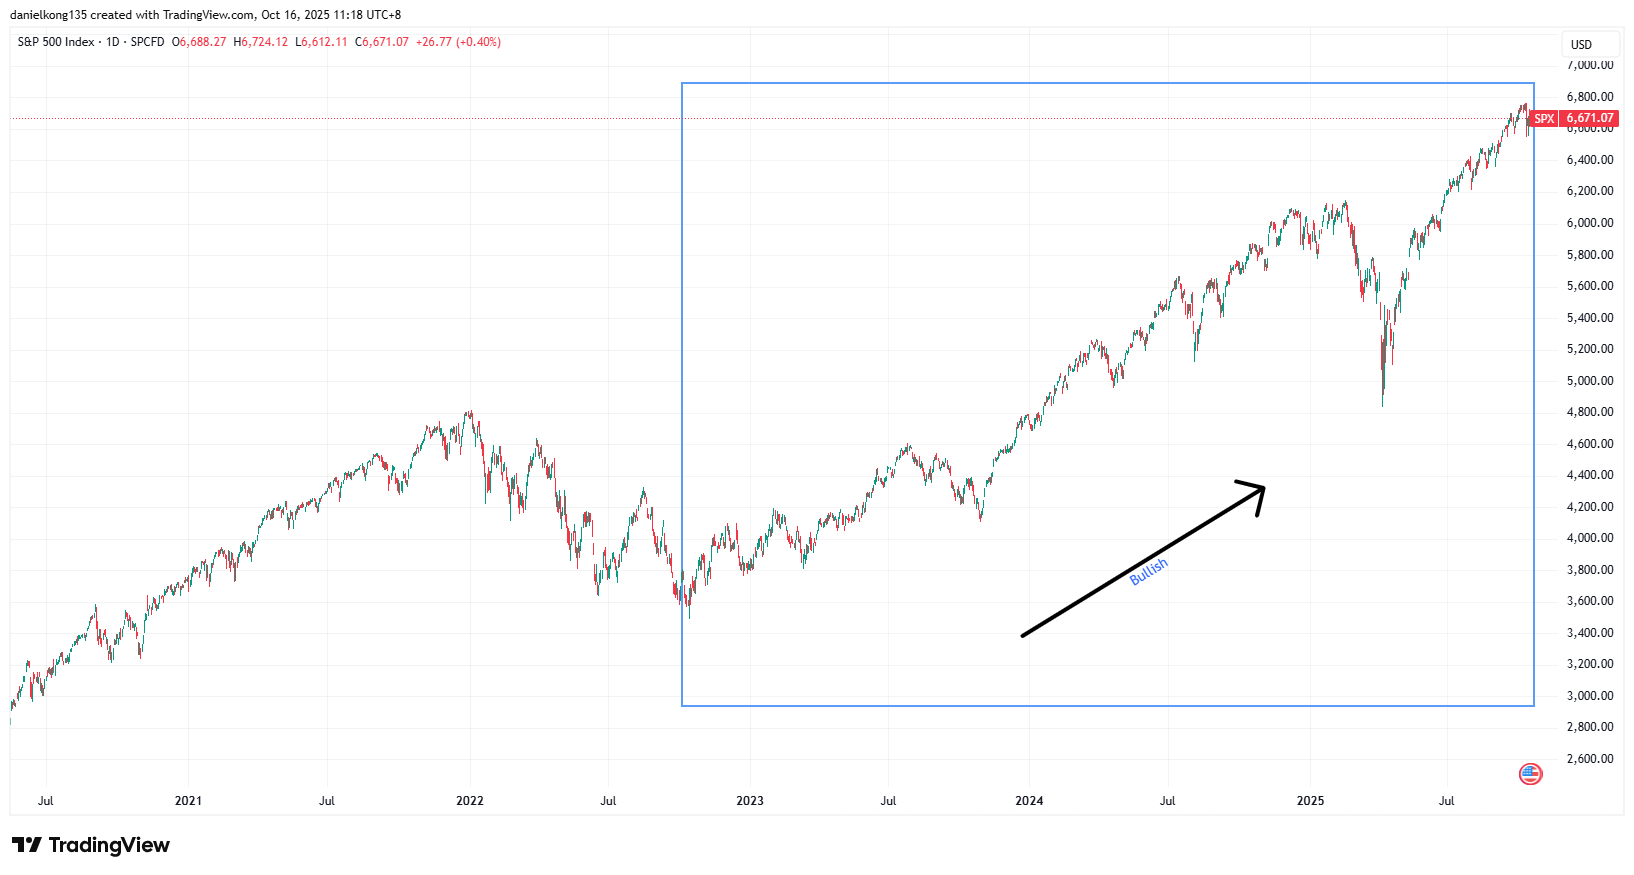
The most significant bull run in the US stock market in recent years began in late 2022 and continued through 2024 into 2025. Fuelled by optimism around artificial intelligence (AI) and expectations of Federal Reserve interest rate cuts, the S&P 500 climbed to record highs. Tech giants such as Nvidia, Microsoft, and Amazon led this rally, marking one of the strongest bull runs since the post-pandemic recovery.
As can be seen in the chart above, the SPY (an exchange-traded fund which tracks the S&P 500) charted a strong upward trend throughout the period, with the index rising by approximately 80%.
Typical of any bull rally, there were price dips that took place along the way, with at least one significant price plunge in April 2025 driven mainly by tariff announcements. However, prices subsequently recovered and continued trending upward during that period.
What Does Bearish Mean?
If a bullish market is one of rising prices and increasing optimism, then a bearish market is one where the opposite happens. In a bearish market, prices are declining, confidence is falling, and investors expect weaker economic performance ahead.
Bearish conditions often arise during economic downturns, recessions, or periods of heightened uncertainty. During these phases, investors lose confidence and become more pessimistic about the market outlook. A routine market correction can be seen as the signal of a larger crash, causing deeper sell-offs and pushing prices lower.
This creates even more volatility and uncertainty in the market, producing a negative feedback cycle driven by fear, uncertainty, and doubt.

Bearish markets can be identified by these four key characteristics:
- Falling asset prices and weak buying momentum
- Investor pessimism and risk aversion
- Increased volatility as investors turn more reactionary
- Weak or contracting economic data
As with bullish sentiment, traders describe bearish views by degree.
- Strongly bearish describes a high-conviction expectation of a substantial price decline — typically expressed through significant short positions or aggressive hedging strategies.
- Mildly bearish reflects more cautious pessimism: a trader may reduce long exposure or rotate into defensive assets without fully committing to a short position.
These distinctions are relevant when reviewing analyst forecasts or positioning data, where the scale of bearish conviction shapes how participants are likely to respond to incoming market information.
Technical Indicators of Bearish Sentiment
A bearish market typically develops when selling pressure outweighs buying interest and prices begin forming consistent downtrends. Traders look for a combination of technical signals that confirm weakening momentum and a shift toward pessimism.
1. Lower highs and lower lows
The most visible sign of a bearish trend is a chart pattern of lower highs and lower lows. Each rally fails to reach the height of the previous one, and each subsequent sell-off dips even lower. This price action signals that sellers are in control and buyers lack the conviction to reverse momentum.
2. Moving averages sloping downward
In bearish conditions, moving averages turn lower and start charting downward slopes, reflecting sustained weakness over time.
- Short-term moving averages (like the 50-day MA) typically fall below the long-term averages (such as the 200-day MA).
- This pattern, known as a death cross, often confirms that the market has transitioned into a longer-term downtrend.
- The steeper the downward slope, the stronger the bearish momentum.
3. Trading volume builds as prices fall
During a bearish phase, trading volume tends to increase when prices fall and taper off during brief rallies. This shows that more investors are actively selling as conviction evaporates, while fewer are willing to step in and buy.
4. Relative Strength Index (RSI) below mid-range
The RSI often stays in the 20 to 40 range during a bearish market, signalling persistent selling pressure. An RSI consistently below 50 indicates that downward momentum is dominant. When RSI dips below 30, this is often taken as the market being oversold. In strong bear markets, RSI can remain at low levels for extended periods.
5. Negative MACD crossover
When the MACD line crosses below its signal line, it helps confirm bearish momentum. When both lines are moving downward and the histogram turns negative, it points to strengthening downside momentum. Sustained MACD readings below zero further reinforce the bearish trend.
6. Breakdown below support levels
Support levels act as price floors during normal market conditions. In a bearish market, however, prices often break down below key support zones, triggering stop-loss orders and accelerating selling pressure. When a breakdown below support is confirmed by high trading volume, it suggests that sentiment has turned decisively negative.
7. Rising volatility
Bearish markets are typically accompanied by higher volatility, as evidenced by rising readings on the Volatility Index (VIX). There is also intensified movement towards safe-haven assets such as government bonds and gold, indicating that investors are becoming more risk-averse.
Taken together, these technical indicators help traders identify when a market has entered or confirmed a bearish phase. While short-term rebounds may occur, sustained bearish signals across multiple timeframes typically indicate underlying weakness.
A Recent Example of a Bearish Market
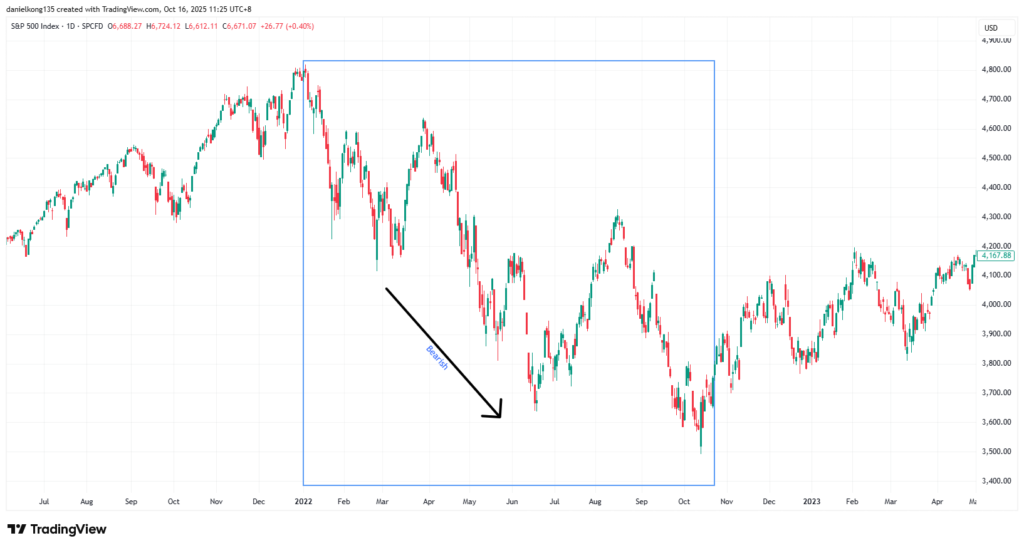
One of the most recent bear markets occurred between January and October 2022, when the S&P 500 fell by roughly 25% from its peak. This was the steepest annual drawdown since the 2008 financial crisis.
The downturn was driven by a combination of factors including surging inflation, aggressive interest rate hikes by the US Federal Reserve, and fears of a potential recession. Rising borrowing costs weighed heavily on high-growth sectors such as technology, while corporate earnings forecasts weakened amid slowing consumer demand.
In response, investor sentiment turned sharply risk-averse, prompting a shift from equities into safe-haven assets such as the US dollar and Treasury bonds. By October 2022, the market had entered a clear bearish phase, reflecting widespread concern about economic stability and tighter financial conditions.
Bullish vs Bearish – Key Differences at a Glance
| Market direction | Prices rising, higher lows and higher highs, breaks through previous resistance levels | Prices falling, lower highs and lower lows, falls below previous support levels |
| Investor sentiment | Optimistic, confident | Pessimistic, fearful |
| Economic signals | Strong GDP growth, low unemployment, falling interest rates | Weak growth, rising unemployment, rising interest rates |
| Trading volume | Higher due to increased buying activity | Lower as investors hold back |
| Common examples | S&P 500 rally from October 2022 to April 2025; AI and semiconductor stocks through 2025–2026 | S&P 500 bear market January–October 2022; oil market structural oversupply outlook through early 2026 |
How to Identify if a Market is Bullish or Bearish
Recognising whether a market is bullish or bearish requires more than just watching prices rise or fall. Traders and investors typically use a combination of technical, fundamental, and sentiment analysis to build a complete picture of market direction and strength.
Each approach offers different insights, with technical analysis focussing on price action, fundamental analysis examining the underlying economy, and sentiment analysis gauging investor mood.
Using Technical Analysis
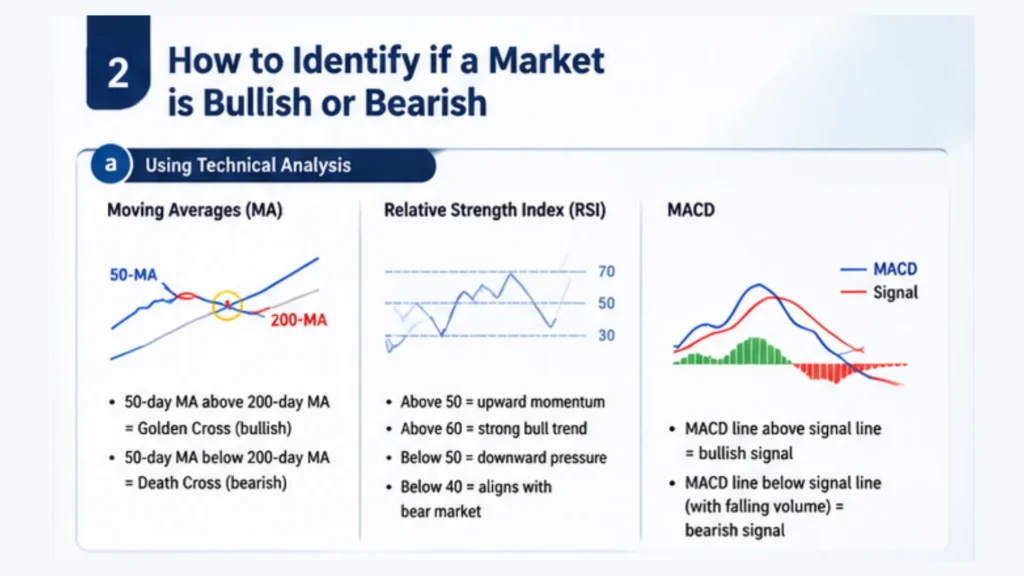
Technical analysis is the study of price charts and trading patterns to identify market trends. One widely used technical indicator is the moving average (MA).
When short-term averages, such as the 50-day MA, move above long-term averages, like the 200-day MA, it forms what traders call a golden cross — a classic signal of a bullish market. The reverse pattern (when the short-term average crosses below the longer-term average), known as a death cross, indicates a shift toward bearish conditions.
The Relative Strength Index (RSI) is another useful indicator, measuring the speed and magnitude of recent price movements. Readings above 50 generally suggest upward momentum, while readings below 50 indicate downward pressure. An RSI that stays above 60 often confirms a healthy bull trend, whereas sustained levels below 40 typically align with a bear market.
Thirdly, the Moving Average Convergence Divergence (MACD) helps traders identify changes in momentum. When the MACD line crosses above its signal line, it can signal the start of a bullish phase. A crossover below the signal line, especially when combined with declining volume, suggests momentum is fading and a bearish turn may be developing.
Using Fundamental Analysis
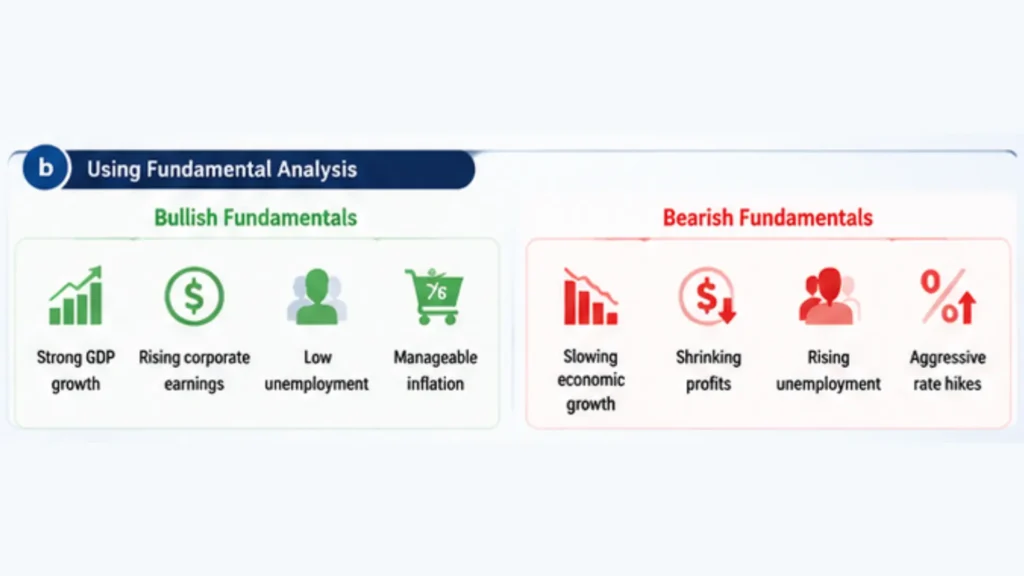
While technical indicators help decipher what price movements mean, fundamental analysis explains why prices are moving that way. The practice looks at the broader economic and financial factors that drive markets.
In bullish conditions, economic fundamentals often show strong GDP growth, rising corporate earnings, low unemployment, and manageable inflation — all of which signal a healthy economy that supports rising asset prices.
In contrast, bearish markets tend to emerge when fundamentals weaken. Slowing economic growth, shrinking profits, or aggressive interest rate hikes can all pressure stock markets, forcing prices to fall.
Traders may watch quarterly earnings reports, inflation data, and central bank announcements closely; a pattern of deteriorating numbers often confirms a bearish environment.
Using Sentiment Analysis
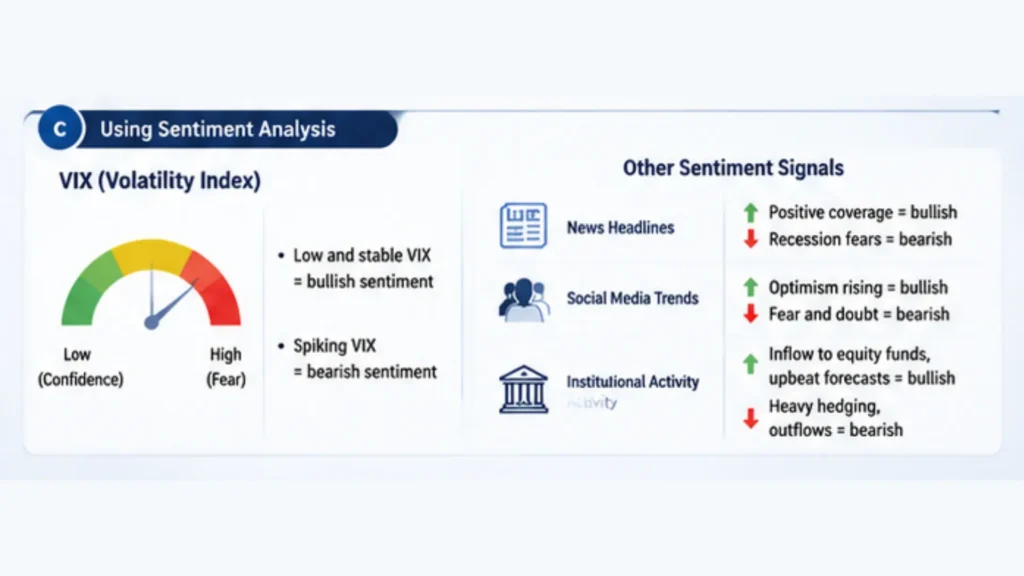
Market sentiment captures how investors feel about the market — optimistic or pessimistic — and often acts as an early warning system before trends become obvious in data or price charts.
One popular tool for sentiment analysis is the VIX (Volatility Index), also known as the market’s “fear gauge”. VIX tends to remain low and stable during bullish periods, reflecting confidence. When the VIX spikes, it signals heightened uncertainty or fear, which often accompanies bearish conditions.
Beyond the VIX and other formal indicators, sentiment can also be measured through news headlines, social media trends, and moves made by institutional investors. Widespread positive coverage, strong inflows into equity funds, and upbeat analyst forecasts often coincide with bull markets. On the other hand, headlines focused on recession risks or heavy institutional hedging point toward growing bearish sentiment.
By combining these three types of analysis — technical, fundamental, and sentiment — traders can gain a more rounded understanding of market conditions. No single indicator is definitive, but when several signals align, they provide compelling evidence of whether a market is entering a bullish or bearish phase.
Bullish and Bearish Market Examples in 2026
As of mid-2026, markets have displayed a marked divergence in bullish and bearish conditions across different asset classes, offering clear illustrations of each market phase in practice.
The following examples are provided solely for educational and illustrative purposes and do not constitute investment advice, a recommendation, or an indication of future market performance.
Bullish: AI and semiconductor stocks
The artificial intelligence and semiconductor sector has sustained one of the strongest bullish trends in global equity markets through 2025 and into 2026. Demand for AI chips, data centre infrastructure, and advanced computing capacity has driven substantial gains across the sector.
Broadcom posted first-quarter 2026 AI semiconductor revenue of $8.4 billion — a 106% increase year-over-year — and guided second-quarter AI semiconductor revenue to $10.7 billion [1]. Analyst coverage of NVIDIA remained broadly positive through mid-2026, although analyst opinions and price targets vary and should not be relied upon as predictors of future performance [2]. The global semiconductor market is forecast to reach approximately $975 billion to $1 trillion in 2026 annual sales, with AI chips approaching half of total industry revenue for the first time in history, according to projections from Deloitte and KPMG [1].
As with any sustained bull run, the trend has not been free of volatility. Cautious quarterly guidance from Broadcom in early June 2026 triggered a sector-wide sell-off — a reminder that corrections occur within broader uptrends, and that individual earnings announcements can shift short-term sentiment even in strongly bullish sectors.
Bearish underlying structure, disrupted by geopolitics: oil
Through 2025 and into early 2026, oil markets showed clear bearish structural signals. According to the International Energy Agency’s April 2026 Oil Market Report, global oil supply was on track to outpace demand by approximately 3.7 million barrels per day in 2026 before any external disruption — the largest projected surplus since 2015–2016 [3]. Rising US crude production and OPEC+ output increases reinforced the downward price pressure.
This bearish fundamental picture was then dramatically altered by military action near the Strait of Hormuz, which effectively closed the waterway from late February 2026. Production shut-ins across the Middle East averaged over 11 million barrels per day in May 2026, according to the EIA’s June 2026 Short-Term Energy Outlook [4]. Brent crude, which had been trading in a structurally bearish environment through 2025, averaged approximately $107 per barrel in May 2026 — far above the pre-conflict consensus forecasts.
This example illustrates a key principle in market analysis: geopolitical events can rapidly override fundamental trends. The structural bearishness of the oil market had not changed; it was overlaid by a supply shock with an uncertain duration. Identifying which force is dominant at any given moment — fundamentals, sentiment, or exogenous events — is central to accurately reading bullish and bearish conditions.
How Traders React to Bullish vs Bearish Conditions
Traders know to adjust their strategies and approach when market conditions change. In bullish markets, trading behaviour often focuses on capturing upside momentum. However, when conditions turn bearish, the focus shifts to protecting capital and managing risk.
Traders during bullish markets
In bullish markets, traders often focus on momentum strategies, i.e., buying assets that are trending upward and holding them as long as the momentum remains strong. The idea is to utilise long positions to capture capital appreciation as prices tend to continue rising during a bull market. Traders rely on technical indicators like rising moving averages and strong volume to confirm continued strength in the trend.
Traders during bearish markets
In bearish markets, trader behaviour shifts toward capital preservation and risk management. Many participants use hedging strategies, such as purchasing put options or entering short positions, to offset potential losses in their portfolios. Short selling allows traders to profit from falling prices by borrowing and selling an asset, with the intention of buying it back at a lower price. However, these strategies carry additional risks and are typically used by more experienced traders to balance exposure during downturns.
Another defensive approach in bear markets is to rotate into safe-haven assets such as gold, government bonds, or stable currencies. These assets tend to retain or increase value when riskier markets decline, helping to smooth portfolio volatility. Traders may also diversify across asset classes or increase cash holdings to reduce exposure until clearer bullish signals reappear.
Accessing both market phases through CFDs
Contracts for Difference (CFDs) are leveraged derivative products that may be used to gain exposure to rising or falling market movements without ownership of the underlying asset. CFDs carry significant risk and may not be suitable for all investors. A long CFD position may increase in value if the underlying market rises, while a short CFD position may increase in value if the underlying market falls.
It is important to understand that CFD trading involves leverage, which magnifies both potential gains and potential losses relative to the initial margin deposited. This makes disciplined risk management — including stop-loss and take-profit orders — particularly relevant in volatile markets and during periods of rapid sentiment shifts between bullish and bearish phases. CFDs are complex instruments and losses can exceed the initial amount invested.
Common Mistakes When Reading Market Trends
Even experienced traders can misread market signals, especially during volatile periods. Emotions like fear and overconfidence often cloud judgement, leading to poor decisions. Recognising these patterns helps traders stay objective and data-driven.
A common mistake is confusing short-term volatility with a true trend change. Markets often see brief pullbacks or rallies that look dramatic but do not signal a lasting shift. A short dip during a bull run, for example, may simply reflect profit-taking. Skilled traders wait for confirmation from indicators such as volume, moving averages, or broader economic data before calling a reversal.
Overconfidence in bull markets is another trap. When prices rise steadily, traders may assume gains will continue and take on excessive risk or ignore stop-loss orders. Typically, this false optimism peaks just before downturns, leading to avoidable losses. Staying disciplined and following a clear trading plan helps prevent costly mistakes.
In bear markets, panic selling is a common, yet costly, mistake. Sharp declines often trigger emotional reactions, leading traders to sell near the bottom and miss later recoveries. Focusing on analysis rather than emotion allows traders to navigate downturns more rationally.
Ultimately, successful trading relies on discipline and perspective. Markets move in cycles, and by avoiding emotional reactions, traders can make steadier, more informed decisions over time.
Understanding Bullish and Bearish Market Cycles
Bullish and bearish markets represent two sides of the same cycle. Prices, sentiment, and economic indicators constantly shift, creating opportunities and risks alike. Understanding the signs of each condition helps traders stay prepared, adapt their strategies, and navigate market changes with greater clarity.
Markets will always move in cycles. The key is recognising which part of the cycle is underway — and responding with analysis rather than emotion.
Frequently Asked Questions
The questions below address the most common areas of confusion around bullish and bearish terminology, including how these terms apply across different market contexts and trading scenarios.
What Does Bullish Mean in Trading?
Bullish in trading means you expect the price of an asset to rise. A trader who is bullish on an index, currency pair, or commodity believes that buying pressure will outweigh selling pressure, pushing prices higher. In practice, a bullish trader typically holds long positions — buying the asset or a CFD tied to it — and expects to profit if prices move upward as anticipated. The term applies to both short-term views (bullish over the next hours or days) and longer-term expectations (bullish on a sector or economy over months or years).
What Is the Difference Between a Bullish and Bearish Market?
The core difference is direction and sentiment. A bullish market is characterised by rising prices, growing investor confidence, and expanding economic indicators such as GDP growth and employment gains. A bearish market shows the opposite: falling prices, increasing pessimism, and weakening economic conditions. While a bull market may be loosely defined as a sustained 20% rise from recent lows, a bear market is more precisely defined as a decline of 20% or more from recent highs. Historically, bull markets have lasted longer than bear markets — with bull runs lasting a median of approximately 42 months compared to a median of 19 months for bear markets, according to analysis from Fidelity [5].
What Does Strongly Bullish or Strongly Bearish Mean?
Strongly bullish describes high-conviction optimism — an expectation that prices will rise significantly, not just modestly. A trader or analyst who is strongly bullish typically holds larger long positions and maintains them through short-term dips, confident in the underlying trend. Strongly bearish is the opposite: a high-conviction view that prices will fall substantially, typically expressed through significant short positions or aggressive hedging. Analysts use these terms to signal the degree of their conviction, not just the direction. Mildly bullish or mildly bearish, by contrast, reflects a more tentative view — leaning in one direction but with less certainty and typically more conservative positioning.
Is It Better to Be Bullish or Bearish?
Neither is inherently better — it depends on market conditions and what the data supports at any given time. Bullish sentiment tends to align with periods of economic expansion and corporate earnings growth, while bearish sentiment often reflects genuine deterioration in fundamentals or elevated valuations. What matters is whether a trader’s position aligns with the prevailing market reality. Many professional traders take bullish positions in rising markets and adjust to hedging or short strategies as conditions deteriorate, without attaching a value judgement to either stance.
How Do Traders Identify Whether a Market Is Bullish or Bearish?
Traders typically combine technical analysis, fundamental analysis, and sentiment tools. Technical signals such as the golden cross (short-term moving average rising above long-term), RSI readings above 50, and price making higher highs and higher lows together indicate bullish conditions. A death cross, RSI below 50, and lower highs and lower lows suggest bearish conditions. Fundamental indicators — GDP growth, corporate earnings, and central bank policy — provide context for why sentiment may be shifting. Sentiment tools such as the VIX and the AAII Investor Sentiment Survey help gauge how investors are feeling collectively, often acting as early signals before price trends fully develop.
What Do Bullish and Bearish Mean in Forex CFD Trading?
In forex CFD trading, bullish and bearish refer to the expected direction of a currency pair’s price. Being bullish on EUR/USD means you expect the euro to strengthen against the US dollar. Being bearish on the same pair means you expect the dollar to gain relative to the euro. These terms apply to individual currency pairs rather than a single currency in isolation. Forex markets operate continuously and can shift between bullish and bearish conditions rapidly in response to central bank announcements, economic data releases, and geopolitical events.
What Is a Neutral or Sideways Market?
A neutral or sideways market is one that is neither clearly bullish nor bearish — prices move within a defined range without establishing a sustained upward or downward trend. This condition, also called consolidation, occurs when buyers and sellers are in approximate balance. A sideways market is not simply the absence of a trend; it often reflects genuine uncertainty, with participants waiting for a catalyst to resolve direction. For CFD traders, sideways conditions typically call for range-bound strategies rather than the momentum or trend-following approaches suited to clearly bullish or bearish phases.
RISK WARNING: CFDs are complex financial instruments and carry a high risk of losing money rapidly due to leverage. You should ensure you fully understand the risks involved and carefully consider whether you can afford to take the high risk of losing your money before trading.
Disclaimer: The information is provided for educational purposes only and doesn’t take into account your personal objectives, financial circumstances, or needs. It does not constitute investment advice. We encourage you to seek independent advice if necessary. The information has not been prepared in accordance with legal requirements designed to promote the independence of investment research. No representation or warranty is given as to the accuracy or completeness of any information contained within. This material may contain historical or past performance figures and should not be relied on. Furthermore estimates, forward-looking statements, and forecasts cannot be guaranteed. The information on this site and the products and services offered are not intended for distribution to any person in any country or jurisdiction where such distribution or use would be contrary to local law or regulation.
References
- “Q1 2026 AI Semiconductor Supercycle — Tickeron” Accessed 22 June 2026
- “What Triggered the Recent Semiconductor Sell-Off — Kavout” Accessed 22 June 2026
- “Oil Market Report April 2026 — International Energy Agency” Accessed 22 June 2026
- “Short-Term Energy Outlook — US Energy Information Administration” Accessed 22 June 2026
- “Bear vs Bull Market: How to Tell the Difference — Fidelity” Accessed 22 June 2026