Peace plan helps stocks, gold, USD rises too
Jamie Dutta >
Jamie Dutta >
Jamie Dutta is a Market Analyst for Vantage. He comes with extensive experience as a full-time trader and financial market commentator, having worked as a trader in top tier investment banks and trading houses.

* Iran rejects US proposal, sets 5 conditions for ending war
* Dollar gains on scepticism over Iran war de-escalation
* Wall Street advances but best gains prove hard to hold
* Gold rebounds as investors look for re-entry point
FX: USD picked up but traded in the recent range. FX trades on headline flow at present so is whippy. There are hopes of ceasefire talks, even after the US 15-point peace plan was apparently rejected by Iran. It seems the US and Israel have military leverage while Iran holds economic leverage in the form of the closure of the Strait of Hormuz and high oil prices. Positioning data points to a major shift in short-term, speculative sentiment. Futures (CFTC) data show traders running the largest net dollar long in aggregate since early December. Strong resistance resides at recent and November highs around 100.34/54.
EUR dipped as markets contended with lots of news flow around the Middle East. The German IFO business index showed that soaring energy prices and new uncertainty had unsurprisingly hit sentiment. Risks have clearly shifted to the downside once again, although Germany’s rebound is still in play unless the conflict is prolonged. ECB President Lagarde highlighted that “small, one-off and short-lived supply shocks can be looked through” but noted that it “will not be paralysed by hesitation”. Neutral range trading may develop in the short term, with the 200-day SMA at 1.1675, and a major Fib retracement level at 1.1675 also.
GBP marginally outperformed though still finished lower on the day. The 200-day SMA sits at 1.3430. Headline UK CPI came in as expected at 3%, but core and services inflation were a little hotter at 3.2% and 4.3%. This data is stale as it is from February, so the key focus now is on how long the Iran conflict lasts and how higher energy prices ripple through the UK economy. Recent comments from hawkish MPC members have bolstered bets on an April rate hike. That is now around 70% priced in.
JPY continued to consolidate below the strong resistance zone around 159.50/160. As we said previously, that was probably the line in the sand for FX interventions before the Iran conflict, but there is an obvious disincentive to intervene in a volatile market.
US stocks: The S&P 500 added 0.54% to close at 6,592, the Nasdaq was 0.67% higher at 24,163 and the Dow Jones settled higher by 0.66% at 46,428. All three main indices remain below their 200-day SMAs though the broad-based S&P 500 and the Dow touched the widely watched indicator. The VIX, Wall Street’s fear gauge, remained elevated at 25. The March high sits just above 35. Only two sectors, Energy and Real Estate were in the red, as Materials, Consumer Discretionary and Healthcare led the gainers. Chipmakers like AMD and Intel rallied as Arm jumped over 16% as the company unveiled a new data centre chip. US-listed shares of JD.com and Alibaba rose after the Chinese regulator urged the food delivery industry to end a price war.
Asian stocks: Futures are mixed. APAC stocks rose on the back of optimism over Iran and talks. The ASX 200 gained with strength in miners and gold producers helped by rising bullion prices. The Nikkei 225 outperformed climbing above 53,000 as oil steadied. The Hang Seng and Shanghai Composite were positive as investors digested numerous earnings releases.
Gold rose for a second day as prices touched the 100-day SMA at $4,597 but pared gains. The precious metal is highly sensitive to Fed policy expectations and the dollar. Questions are being raised about gold’s safe haven status. The selloff from its January intraday peak to the trough earlier this week was an epic27%, while the week leading up to Trump’s post threatening to attack Iranian energy installations was its worst five-day decline since 2013. That discouraging precedent was the start of a lengthy bear market.
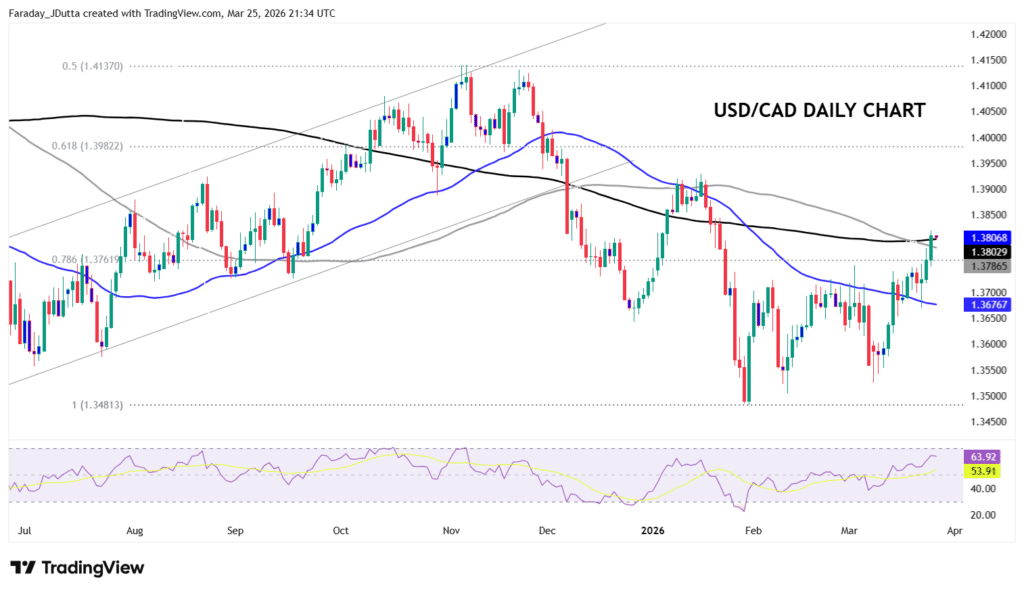
Chart of the Day – USD/CAD up to 200-day SMA
Escalation in the Iran conflict has delivered meaningful USD strength at the start of the week, allowing the CAD to strengthen on the crosses. The major looks to have bottomed below 1.35 with repeated attempts at the upper bound of the local range from January around 1.3750. The level remains important as it’s the last major retracement of the September 2024 to February 2025 rally. The upside breakout has pushed into the 100-day and 200-day SMAs around 1.38. Bulls target the 2026 highs from late January above 1.39 above here.