The falling wedge pattern is a well-known chart formation in technical analysis, valued for its ability to signal potential bullish opportunities during periods of price decline. Formed by converging downward-sloping trendlines, this pattern reflects a market where selling pressure is gradually weakening. As price continues to slide, the rate of decline slows, suggesting that buyers are beginning to step in.
As more buyers enter the market, this signifies a potential shift from bearish to bullish. For this reason, the falling wedge pattern (aka the descending wedge pattern) is regarded as a bullish signal.
Interestingly, the falling wedge pattern (aka descending wedge pattern) can appear as a reversal or a continuation pattern; this depends on whether it appears at the end of a downtrend, or as part of an uptrend.
The falling wedge pattern is a highly useful indicator for spotting or confirming uptrends. Understanding how to correctly identify and trade this setup can help traders improve timing and manage risk more effectively.
Key Points
- The falling wedge pattern highlights weakening selling pressure through converging downward trendlines, often preceding a bullish breakout once price moves above resistance.
- It can function as either a reversal or continuation signal, with interpretation depending on broader trend context, momentum behaviour, and confirmation signals such as volume.
- Reliability improves when the pattern is confirmed by supporting technical tools, while misidentification and false breakouts remain key limitations to be managed carefully.
What is a Falling Wedge Pattern?
The falling wedge pattern is a well-known chart formation used in technical analysis to assess shifts in price momentum. It often appears during periods of price decline and provides insight into how selling pressure evolves over time.
Definition
A popular technical indicator, a falling wedge pattern is a chart formation that develops when price trends lower but does so within a gradually narrowing range. It is defined by two downward-sloping trendlines that converge as time progresses, capturing a series of lower highs and lower lows.
The upper trendline connects the swing highs, while the lower trendline links the swing lows, and both lines slope downward at a decreasing angle. Visually, this looks like a wedge pointing downwards to the right, giving rise to the name “falling wedge pattern”.
While “lower highs, and lower lows” sound like a recipe for a bearish price trend, the falling wedge pattern actually signals a bullish trend. This is because the falling wedge pattern conveys a distinctive property – a loss of downside momentum as the pattern progresses.
In a falling wedge pattern, although price continues to move lower, each push downward becomes weaker than the last. This slowing rate of decline indicates that selling pressure is diminishing, with buyers increasingly willing to step in and prop up the price.
The pattern is usually completed when price breaks decisively above the upper trendline. This breakout signals that buyers have gained control and that a bullish move is expected next.
In many cases, the breakout is accompanied by a noticeable increase in trading volume, which adds confirmation by showing stronger market participation and conviction behind the move.
Is a Falling Wedge Pattern Bullish or Bearish?
Although the falling wedge pattern develops during a period of declining prices, it is generally regarded as a bullish formation. This is because of the momentum present in the pattern – specifically how bearish pressure lessens as the pattern progresses.
Here’s what’s happening. While price continues to move lower and prints lower lows, each downward move clocks in smaller and less aggressive than the last. This slowing pace indicates that selling pressure is gradually weakening.
As sellers lose momentum, buyers begin to absorb supply more effectively at lower price levels. This shift is often subtle at first but becomes clearer as the range tightens and volatility contracts. Eventually, price breaks above the upper trendline, signalling that demand has overtaken supply – a bullish development.
Variations of Falling Wedge Pattern
A falling wedge pattern frequently precedes a price breakout, which leads to either a trend reversal or a trend continuation, depending on the broader market context. These are the two variations of a falling wedge pattern.
- In a trend reversal scenario, the falling wedge develops after a sustained downtrend. Here, the pattern reflects seller exhaustion and a gradual transition of control to buyers. A confirmed breakout above the upper trendline suggests that the prior bearish trend may be ending and that a new bullish phase could be beginning.
- In a trend continuation scenario, the falling wedge forms in a prevailing uptrend as a temporary consolidation or pullback. The slowing rate of price decline signals buyers are still strongly in control and the bullish trend will soon resume.
In both cases, the visual structure of the pattern remains the same. However, evaluating the broader trend, market conditions, and supporting technical signals is essential to correctly interpret whether the falling wedge is acting as a reversal or continuation pattern.
Anatomy of the Falling Wedge Pattern
The anatomy of the falling wedge pattern focuses on the visual and structural elements that distinguish it from other chart formations. By examining how price, trendlines, and volume behave as the pattern develops, traders gain clearer insight into whether downside momentum is fading and a potential bullish shift is forming.
Key Features to Identify a Falling Wedge
Several core characteristics help confirm a valid falling wedge pattern on a price chart. These features work together to show a slowing rate of decline, reduced volatility, and a market that is gradually moving closer to a decisive breakout point.
Downward Sloping
Both the upper and lower trendlines slope downward, reflecting lower highs and lower lows. Note that this downward-sloping movement is essential – a flat or upward-sloping structure would indicate a different pattern entirely, with different interpretations.
Converging Trendlines
The distance between the top trendline (indicating resistance) and bottom trend line (indicating support) gradually narrows as the pattern progresses. This convergence shows that price volatility is decreasing and that the market is approaching a breakout point that will either reverse a downtrend or continue an uptrend.
Declining Volume Channel
Volume typically decreases as the pattern develops. This decline supports the idea that selling pressure is weakening, with market indecision mounting as price consolidates. When a breakout happens, it is usually accompanied by a significant volume spike – this event is often taken as confirmation of a reversal or return to the upside.
Breakout Confirmation
It is important that the falling wedge pattern is not complete until price breaks above the upper trendline. Along with watching for an accompanying spike in volume, conservative traders often wait for a daily close above the trendline or a retest of the breakout level – serving as a second confirmation signal before entering a trade.
Real World Example
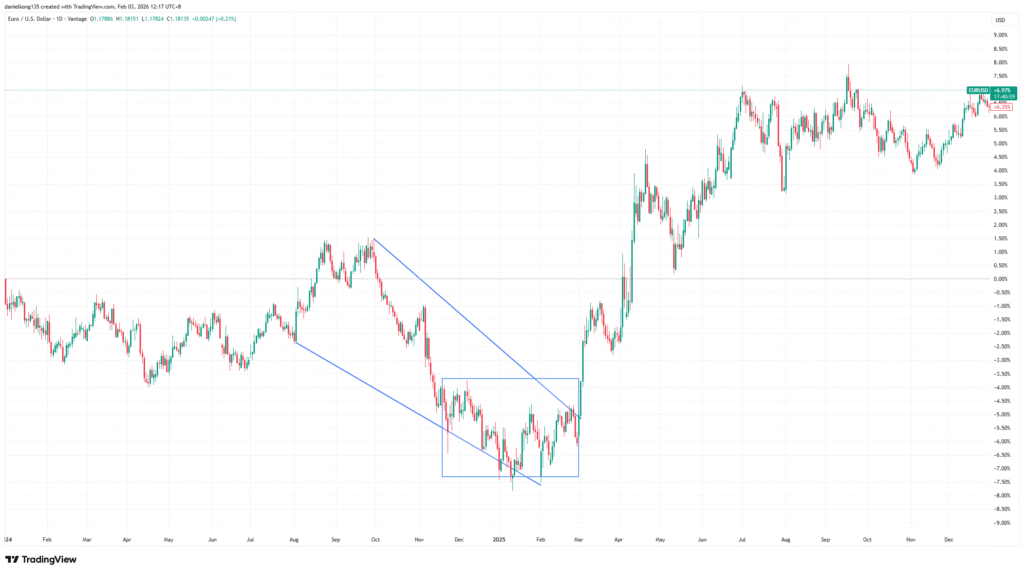
The screenshot above shows the EUR/USD forex pair between Aug 2024 and Mar 2025. During this period, the currency pair continued on a downtrend, with the US Dollar continuing to strengthen against the euro.
However, in early 2024 US economic dominance was called into question. This was spurred by a confluence of factors, including President Trump’s return to the White House and subsequent launch of global trade tariffs; weakening US economics data for the quarter; a shift towards fiscal expansion among European leaders; and a more dovish stance from the European Central Bank.
These developments caused traders to move away from the US Dollar in favour of the euro. This is represented on the EUR/USD price chart, boxed in green; the currency pair is shown bucking the bear trend several times during this period.
Finally, between 3 to 6 March 2025, the euro went on a three-day rally, spiking the pair by more than 3.9% – a result of tariff uncertainty souring market confidence towards the US Dollar [1].
The two trendlines in blue show clearly the formation of a falling wedge pattern. When the breakout happened on 3 March, the pair well and truly exceeded the most recent previous high, going on to chart a strong bull rally until 22 Apr 2025.
Market Psychology
Market psychology plays a central role in how the falling wedge pattern develops and eventually resolves. Rather than focusing only on price direction, this pattern reflects changing behaviour and sentiment among market participants as selling pressure gradually weakens and buying interest begins to surface.
Insight
The psychology behind the falling wedge pattern reflects a shift in control from sellers to buyers. At the beginning of the pattern, sellers remain dominant, continuing to push prices lower in line with the existing trend. However, with each new decline, the intensity of selling starts to fade. Fewer market participants are willing to sell at progressively lower prices, while value-focused and short-term buyers begin to step in.
As the wedge develops and the range between selling price and buying price narrows, uncertainty increases among traders. Sellers who entered earlier in the downtrend may become hesitant to add new positions, while buyers wait for confirmation before committing.
This balance of hesitation leads to reduced volatility and tightening price action, along with a reduction in volume. When the breakout finally occurs, it often triggers a sharp move as trapped sellers rush to exit and sidelined buyers move in quickly. This not only pushes price upwards swiftly, but also creates an expansion in trade volume.
Significance
The falling wedge is significant because it provides a visual representation of weakening downside momentum. Rather than reacting solely to price moving lower, the pattern helps traders understand how that movement is changing over time. The slowing rate of decline suggests that the bearish trend may be losing strength.
By identifying this loss of momentum early, traders gain time to plan potential bullish scenarios. Instead of chasing price after a breakout, they can prepare entry strategies, define risk levels, and wait for confirmation. This forward-looking aspect is what makes the falling wedge especially valuable in technical analysis.
Is Using the Falling Wedge Pattern Reliable?
The reliability of the falling wedge pattern depends on how clearly it is formed and how it is assessed within the wider market context. While the structure can offer valuable insight into shifting momentum, it is most effective when evaluated alongside confirmation signals and an awareness of its limitations, rather than being viewed as a standalone signal.
Pros
When applied correctly, the falling wedge pattern offers several practical advantages for traders.
- It provides a clear and well-defined structure, making it easier to draw trendlines, identify breakout levels, and plan entries and exits.
- It is flexible across multiple timeframes, meaning it can be used by day traders on intraday charts as well as swing and position traders on daily or weekly charts.
- It works well alongside other technical tools, such as momentum indicators, moving averages, and volume analysis, which can improve confirmation and reduce the risk of false signals.
Cons
Despite its strengths, the falling wedge pattern has limitations that traders must be aware of.
- False breakouts can occur, particularly in markets with low liquidity or during periods of heightened volatility. Price may briefly move above the upper trendline before reversing.
- The pattern often requires patience, as it can take time to fully form. Entering too early, before a confirmed breakout, increases the risk of losses.
- Misidentification is also common. If trendlines are drawn inaccurately or the structure does not clearly converge, traders may mistake other formations for a falling wedge.
Avoid common misidentifications of the falling wedge pattern
One of the most common mistakes traders make is confusing a falling wedge with a descending channel or a bear pennant. While these patterns may look similar at first glance, the key difference lies in convergence.
In a true falling wedge, the distance between the upper and lower trendlines gradually narrows, showing a reduction in volatility and momentum. In contrast, a descending channel has parallel trendlines, indicating a more orderly and sustained downtrend. If the space between highs and lows remains consistent over time, the pattern is more likely a channel rather than a wedge. Recognizing this distinction is essential to avoid false expectations of a bullish breakout.
Use the following comparison table to understand the differences between falling wedge pattern and other common chart patterns.
| Pattern | Structure | Trend | Breakout Direction & Outcome | Volume Behavior | Chart diagram |
| Falling wedge pattern | Two downward-sloping, converging trendlines forming lower highs and lower lows within a narrowing range | Can form in a downtrend as a reversal pattern or in an uptrend as a continuation pattern | Typically breaks upward, signalling a bullish reversal or continuation as selling pressure weakens | Volume usually declines during formation and increases noticeably on the upside breakout | https://www.strike.money/technical-analysis/falling-wedge-pattern |
| Descending triangle | Flat support level combined with a downward-sloping resistance line, creating lower highs against a stable base | Most commonly forms during a downtrend and reflects sustained selling pressure | Usually breaks downward, leading to bearish continuation as support eventually gives way | Volume often decreases during formation and expands sharply on the downside breakout | https://www.investopedia.com/terms/d/descendingtriangle.asp |
| Descending broadening wedge | Two downward-sloping trendlines that diverge over time, creating higher volatility and wider price swings | Often appears in unstable or highly volatile market conditions, with no clear trend bias | Breakout direction is less predictable and can result in sharp moves either way | Volume tends to increase as the pattern develops, reflecting growing uncertainty and volatility | https://www.centralcharts.com/en/gm/1-learn/7-technical-analysis/27-chart-patterns/504-descending-broadening-wedge |
| Bull flag | Short-term downward or sideways consolidation following a strong upward price move, forming a small channel or flag | Forms within a strong uptrend as a continuation pattern | Breaks upward, resuming the prior bullish trend after a brief pause | Volume is high during the initial rally, contracts during the flag, and expands again on breakout | https://www.investopedia.com/stock-analysis/cotd/answ20090105.aspx |
| Bearish pennant | Small symmetrical triangle that forms after a sharp downward move, showing brief consolidation | Develops within a strong downtrend as a continuation pattern | Breaks downward, continuing the bearish move after consolidation | Volume spikes during the initial decline, decreases during consolidation, and increases on breakdown | https://centerpointsecurities.com/bearish-pennant-patterns/ |
Falling Wedge Pattern Trading Strategy
A falling wedge pattern trading strategy centres on structure, confirmation, and risk awareness rather than prediction. While the pattern can highlight potential bullish conditions, its practical value lies in how it is combined with clear entry logic, realistic targets, and supporting technical signals.
How to Trade Falling Wedge
Trading a falling wedge pattern is most effective when approached with patience and a rules-based mindset. Instead of trying to anticipate the breakout, experienced traders focus on confirmation, allowing the market to clearly show when buyers have taken control.
The first step is identifying a well-formed falling wedge. Price should be making lower highs and lower lows, with both trendlines sloping downward and gradually converging. The pattern should look compressed, showing that price swings are becoming smaller over time. This visual tightening is a key clue that selling pressure is weakening.
Once the pattern is clearly established, traders closely monitor price as it moves toward the upper trendline. A valid trading signal occurs when a candle closes decisively above this resistance level. A strong close, rather than a brief intraday move, helps confirm that the breakout is genuine and not just a temporary spike.
Entry is commonly placed after the breakout candle has closed above the upper trendline. This approach reduces the risk of false breakouts, which are common when price briefly pushes above resistance and then quickly reverses. More cautious traders may wait for a pullback toward the broken trendline. If price holds above this level and starts to move higher again, it often provides a more conservative entry with clearer risk control.
Risk management is a critical part of trading the falling wedge pattern. A stop-loss is used to protect capital if the trade does not develop as expected. Typical stop-loss placement is just below the most recent swing low or beneath the lower boundary of the wedge. If price returns below these levels, it suggests that bullish momentum has failed and that exiting the trade is the prudent choice.
Calculating the profit target
Defining a profit target in advance helps traders avoid emotional decision-making and creates a clear plan for managing the trade. One of the most widely used methods for the falling wedge pattern is the measured move approach.
To apply this method, traders measure the vertical distance of the widest part of the wedge, which usually appears near the start of the pattern. This measurement reflects the size of the earlier price swings before momentum began to fade. That same distance is then projected upward from the breakout point to estimate a potential upside target.
This projected level serves as a guideline rather than a guaranteed outcome. Price may reach the target, exceed it, or fall short depending on market conditions. For this reason, many traders combine the measured move with other reference points, such as prior resistance levels or psychological price zones, to refine their exit strategy.
Some traders also choose to scale out of their position, taking partial profits as price moves higher while allowing the remaining portion of the trade to run. This approach can help lock in gains while still benefiting from further upside if the breakout develops into a stronger trend.
Managing risk using other technical tools
Relying on the falling wedge pattern alone can expose traders to unnecessary risk, especially in choppy or unpredictable markets. Using additional technical tools helps confirm whether a breakout is supported by momentum, trend strength, and market participation. For beginner traders in particular, these tools can be invaluable, reducing the chances of acting on weak or misleading signals.
When multiple indicators point in the same direction, confidence in the trade setup increases and risk becomes easier to manage.
Relative Strength Index (RSI)
The Relative Strength Index, or RSI, is a momentum indicator that measures how quickly and strongly price is moving. It oscillates between set levels, helping traders assess whether an asset may be overbought or oversold.
In the context of a falling wedge pattern, traders often look for bullish divergence. This occurs when price continues to make lower lows, but the RSI forms higher lows instead. This divergence signals that downward momentum is weakening, even though price has not yet turned higher.
When bullish divergence appears while a falling wedge is forming, it suggests that sellers are losing strength and that a bullish breakout may be developing beneath the surface. For beginners, this can be a useful early signal that the pattern is worth paying closer attention to.
Moving averages (MA)
Moving averages (MA) smooth out price fluctuations and help traders identify the overall direction of the market. Some popular moving averages include the 50-day MA (calculated using prices over the past 50 trading periods) and the 200-day MA (derived over a longer 200 trading periods). They are widely used to measure medium-term and long-term trends.
When price crosses over a significant MA as it approaches a breakout point, this is a strong confirmation of a bullish reversal. It suggests that price is not only breaking out of the pattern but also moving back in line with the broader trend. After the breakout, moving averages often act as dynamic support, meaning price may temporarily pull back toward the average before continuing higher.
For beginners, moving averages also provide a visual reference for trend bias, helping avoid trades that go against the dominant market direction.
Moving Average Convergence Divergence (MACD)
The Moving Average Convergence Divergence, or MACD, is a momentum indicator that highlights changes in trend strength and direction. It does this by comparing two moving averages and plotting their relationship over time.
A bullish MACD crossover occurs when the faster-moving line crosses above the slower-moving line. When this crossover happens near the breakout of a falling wedge, it suggests that bullish momentum is building at the same time price is breaking higher.
This alignment between price action and momentum often improves the reliability of the trade. For newer traders, the MACD can serve as a simple confirmation tool, reinforcing what is already visible on the price chart.
Fibonacci Retracement Levels
Fibonacci retracement levels are commonly used to identify areas where price may encounter resistance or support. These levels are based on recurring mathematical ratios that frequently appear in financial markets.
If price breaks out from the lower resistance line close to an important Fibonacci level (eg, 38.2% or 61.8%) this strengthens the bullish reversal signal.
After a falling wedge breakout, traders often draw Fibonacci retracement levels using the most recent swing high and swing low. The resulting levels can highlight price zones where the market may pause, consolidate, or reverse.
By aligning profit targets with these Fibonacci levels, traders identify more accurate entry and exit positions. This approach helps replace guesswork with a structured plan, especially useful for beginners who are still developing confidence in trade management.
Volume analysis
Volume is one of the most important tools for confirming a falling wedge breakout. During the formation of the wedge, volume typically declines as selling pressure fades and market interest temporarily decreases.
A valid breakout should be accompanied by a clear increase in volume. This surge indicates strong participation from buyers and shows that the move is supported by real demand rather than short-term price fluctuations. Breakouts that occur on low volume are more likely to fail, as they lack broad market commitment.
For beginner traders, volume can be used as a final confirmation check. If price breaks above the wedge but volume remains weak, it may be safer to wait for further confirmation before entering the trade.
How to Trade Falling Wedge Pattern in Different Markets
The falling wedge pattern can appear across a wide range of asset classes, but its behaviour and reliability may vary depending on market structure and external influences. Factors such as liquidity, trading hours, macroeconomic drivers, and the availability of volume data all shape how the pattern forms and how breakouts unfold.
Stock market
In the stock market, falling wedge patterns often develop during pullbacks within strong upward trends or near the end of prolonged declines. These pullbacks may occur as investors take profits or wait for new information, causing price to drift lower in a controlled and weakening manner. The falling wedge helps traders identify when this downward move is losing momentum and when buyers may be preparing to step back in.
When trading falling wedges in stocks, it is important to consider company-specific and market-wide factors. Earnings announcements, economic data releases, and broader market sentiment can significantly impact price behavior. A breakout that occurs just before earnings, for example, may carry higher risk due to increased volatility. Many traders prefer to wait for these events to pass before acting on a technical pattern.
Volume plays a key role in stock market breakouts. A falling wedge breakout supported by rising volume suggests strong institutional participation, which can improve the reliability of the move. Traders also tend to watch key resistance levels, such as previous highs or psychological price zones, when setting profit targets.
Forex market
In the forex market, falling wedge patterns frequently form during corrective phases within longer-term trends. Currency pairs often move in waves, and falling wedges commonly appear as price temporarily retraces before resuming its primary direction. This makes the pattern particularly useful for trend-following traders.
Because the forex market is highly liquid and operates around the clock, traditional volume data is less centralised than in stock markets. As a result, traders often rely more heavily on momentum indicators, such as RSI or MACD, to confirm weakening selling pressure and breakout strength. These indicators can help validate the falling wedge when volume information is limited or inconsistent.
Forex traders also pay close attention to macroeconomic events, including interest rate decisions, inflation data, and central bank announcements. These factors can either support or invalidate a falling wedge setup very quickly. For this reason, combining the pattern with sound risk management and awareness of the economic calendar is especially important when trading falling wedges in forex markets.
Trade the hottest stocks and most popular forex currency pairs with Vantage CFDs. With the ability to go both long and short, CFDs allow you to potentially profit from both market directions.
Falling wedge pattern – a valuable chart pattern for all traders
The falling wedge pattern is a valuable chart formation that helps traders identify potential bullish opportunities during periods of price decline. By highlighting weakening selling pressure and a gradual shift in momentum, it offers insight into when a price downtrend may be coming to an end. Whether it appears as a reversal after a prolonged decline or as a continuation within an existing uptrend, the structure of the pattern provides clear visual cues for planning trades.
For beginners, the key to using the falling wedge effectively is patience and confirmation. Waiting for a decisive breakout above the upper trendline, setting realistic profit targets, and using stop-loss orders are essential steps in managing risk. Combining the pattern with supporting tools such as RSI, moving averages, MACD, Fibonacci levels, and volume analysis can further improve reliability and confidence.
Like all technical patterns, the falling wedge is not guaranteed to succeed on every trade. However, when used in the right market context and alongside sound risk management, it can become a powerful part of a trader’s technical analysis toolkit. With practice and consistent application, traders can use the falling wedge pattern to make more informed, disciplined, and strategic trading decisions across different markets.
Looking to embark on your trading journey? Practise identifying and trading the Falling wedge on Vantage’s demo account. When you’re ready, open a live account and apply your skills in real-time markets.
Frequently asked questions
Is a falling wedge pattern bullish?
Yes, a falling wedge pattern is read as a bullish pattern due to lessening momentum from sellers as the pattern progresses. Falling wedge patterns may signal a bullish reversal, or a continuation of a prevailing uptrend.
How do you confirm the falling wedge pattern?
To confirm the falling wedge pattern, look for a sharp increase in volume at breakthrough. You can also cross-check the falling wedge pattern with technical indicators such as RSI and MACD.
What is the psychology of the falling wedge pattern?
The falling wedge pattern signifies a shift in control from the bears to the bulls. With each decline, selling pressure reduces, manifesting as a slowdown in momentum. Sellers become increasingly hesitant to enter the market, while buyers’ conviction mounts as they wait for confirmation. When the breakout occurs, this triggers a sharp move characterised by a spike in price and trading volume.
How reliable is a falling wedge pattern?
A falling wedge pattern is fairly reliable, but like all chart patterns, it is not flawless. Be sure to watch for clear breakout signals and confirm with trade volume analysis and/or another technical indicator.
What is the difference between falling wedge and rising wedge pattern?
While a falling wedge pattern is read as bullish, a rising wedge pattern is seen as a bearish signal. The rising wedge forms from converging trendlines that mark higher highs and higher lows. Along with declining volume, this indicates that buying momentum is slowing, paving the way for a downtrend to form.
References
- “EUR/USD Explodes: 2nd Strongest Weekly Gain in Past Decade (For Now) – Forex.com”. https://www.forex.com/en/news-and-analysis/eurusd-explodes-2nd-highest-weekly-gain-in-past-decade/ . Accessed 3 Jan 2026.