Price action often unfolds like a negotiation between buyers and sellers, with each side testing the other until one gains control.
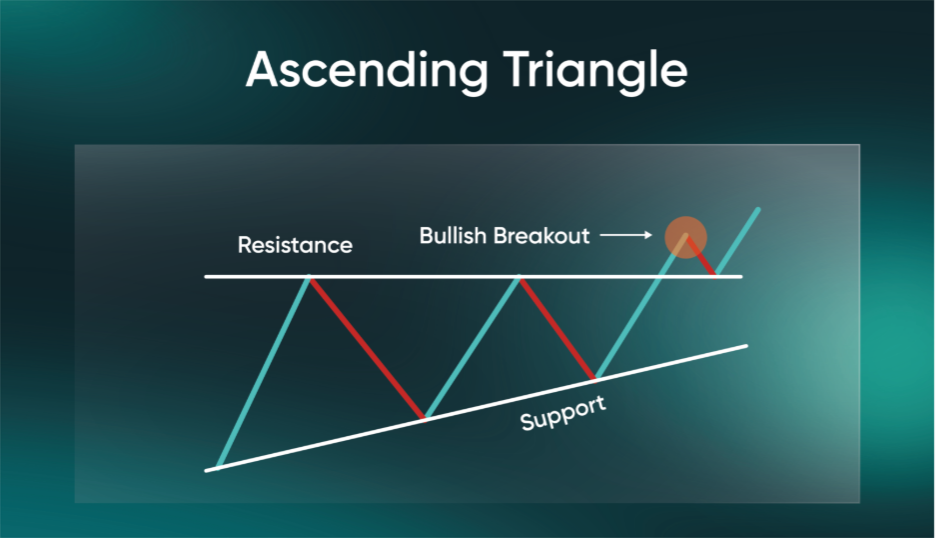
The ascending triangle pattern reflects this dynamic clearly: A horizontal ceiling of resistance where sellers repeatedly step in, and a rising floor of higher lows where buyers grow increasingly confident.
In technical terms, the ascending triangle chart pattern forms when price bounces below a flat horizontal resistance line while successive pullbacks create higher lows along an upward-sloping support line.
The narrowing range between those two trendlines signals growing buying pressure. Volume typically contracts as the range tightens, reflecting reduced participation during consolidation. A meaningful breakout is often accompanied by an increase in volume, indicating a potential bullish continuation which can help confirm market interest in the move.
Although the ascending triangle is generally viewed as a bullish pattern, the inverse structure—where support stays flat and the highs trend lower—is known as a descending triangle pattern. Both belong to the broader triangle pattern family commonly used to evaluate consolidation and breakout behaviour.
Keep reading to find out how to identify an ascending triangle pattern and add it to your technical analysis toolkit.
What Is an Ascending Triangle Pattern?
In technical literature, the ascending triangle pattern is a commonly used chart formation that reflects a market where buyers are gradually strengthening while sellers continue to defend a fixed resistance area.
As price compresses between rising support and horizontal resistance, the pattern highlights a period of tightening pressure that may lead to a decisive breakout.
Related Article: The Basics of Support and Resistance
Definition of the Ascending Triangle Pattern
In an educational context, an ascending triangle pattern is perceived as a bullish continuation chart pattern with the following key structural elements:
- A horizontal resistance line at the top, created by at least two similar swing highs
- A rising support trendline formed by progressively higher lows
As price oscillates between the two trendlines, the range contracts and the market ‘squeezes’ towards an eventual decision point.
The ascending triangle candlestick pattern is commonly seen in an uptrend—but it can also appear after a downtrend, acting as either a continuation or reversal pattern depending on prevailing market conditions.
Related Article: 16 Candlestick Charts Traders Need to Know
Real-World Example: Ethereum in 2025
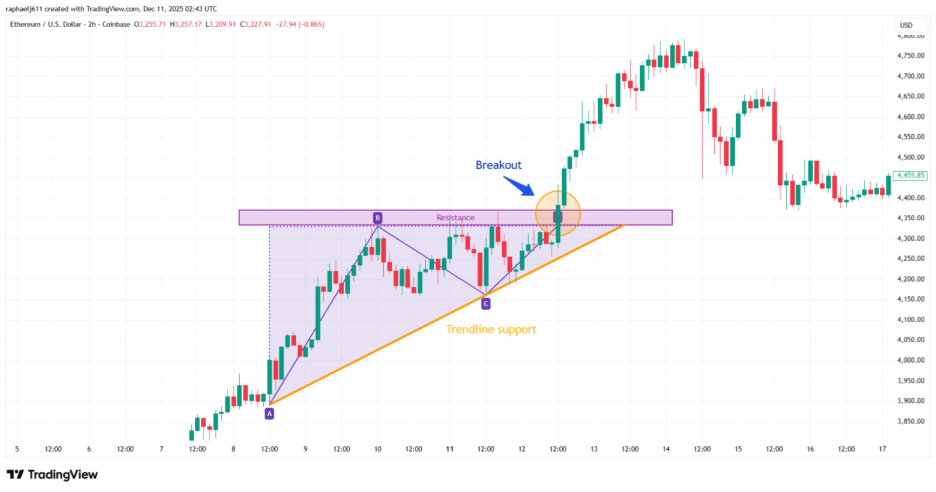
ETHUSD in August 2025 (https://www.tradingview.com/x/gdQ3epmt/)
From 8 to 12 August, Ethereum repeatedly tested the $4,300 to $4,350 resistance zone, where sellers consistently capped the advance. During this period, buyers stepped in at progressively higher levels—first near $4,050, then around $4,150, and later close to $4,250—forming a clear rising trendline of support.
This tightening structure signalled growing demand meeting a steady area of supply. As the range narrowed, buying pressure eventually absorbed the remaining sell orders at the resistance line. This led to a clean breakout above $4,350, followed by a strong continuation to the upside.
Formation of the Ascending Triangle Pattern
The ascending triangle develops through a series of structural features that reveal how buyers and sellers interact as the pattern forms. Understanding these characteristics can help to distinguish high-quality structures from weaker formations.
6 Key Features to Identify an Ascending Triangle
Want to learn how to identify an ascending triangle pattern? Here are six key features to take note of:
1. Horizontal Resistance Line
This upper boundary forms where sellers repeatedly defend the same price zone.
- What It Represents: A stable area of supply
- Implication: Repeated tests without a breakdown indicate persistent buyer interest
- Takeaway: A breakout above this level may signal a shift in control towards buyers
2. Lower Ascending Trendline
A rising support line connects the pattern’s higher lows.
- What It Represents: Buyers are stepping in and becoming more assertive
- Implication: A clean progression of higher lows strengthens the bullish bias
- Takeaway: A break below this trendline weakens the overall pattern
3. Converging Trendlines
As the rising support approaches the horizontal resistance, the triangle narrows.
- What It Represents: Momentum compresses with a build-up of pressure
- Implication: Market movements often appear more decisive as they near the apex
- Takeaway: Breakouts (up or down) become more likely as space tightens
4. Duration
Ascending triangles can form over various timeframes such as:
- Shorter Formations: Typically appear on intraday charts during momentum-driven phases
- Longer Formations: Often appear on weekly or monthly charts, reflecting steadier accumulation
5. Volume
Volume often contracts as the triangle forms, reflecting reduced participation during the consolidation. A successful breakout—whether continuation or reversal—may occur alongside an increase in volume, which can indicate stronger market engagement.
Volume behaviour can vary by instrument and timeframe, so it should be interpreted within a broader market context rather than as a standalone signal.
6. Return to Breakout (Retest)
After breaking above resistance, price may return to test the old ceiling as the new support level.
- What It Represents: Buyers defending the breakout level to establish a new floor
- Implication: A successful retest reinforces the breakout’s validity
- Takeaway: Some traders prefer retests to avoid chasing initial breakout candles
How to Tell Whether the Ascending Triangle Will Continue or Reverse
Ascending triangles can lead to continuation or reversal depending on where they appear and how price and volume behave at key decision points.
Bullish Continuation on an Ascending Triangle Pattern
When an ascending triangle chart pattern forms within an existing uptrend, the narrowing structure often reflects growing demand. From an educational standpoint, potential signs supporting an ascending triangle continuation pattern include:
- Breakout Candle: A full-bodied close above resistance rather than a brief wick.
- Volume Behaviour: A surge in volume compared with recent consolidation.
- Successful Retest: Price holds above the former resistance level after the breakout. A clean retest and rebound may confirm a continuation trend.
Take note that these factors do not guarantee further upside but might indicate continued market interest.
Reversal to Bearish on an Ascending Triangle Pattern
In some cases—after a preceding downtrend—an ascending triangle may resolve to the downside if buyers cannot sustain momentum near resistance.
According to technical literature, signals that may accompany bearish reversals include:
- Breakdown Below Support: A decisive move beneath the rising trendline, signalling that sellers are gaining control.
- False Breakouts: Price briefly moves above resistance but closes back inside the pattern.
- Lower High Formation: A failure to retest resistance with equal strength, such that the market does not make a new high.
- Momentum Shifts: Indicators such as Relative Strength Index (RSI) or Moving Average Convergence Divergence (MACD) turning lower (used as supplementary context and not standalone confirmation)—we’ll discuss more in later sections.
Always remember that risk management is key, as reversals from ascending triangles can occur quickly if pressure unwinds.
Market Psychology Behind the Ascending Triangle
Price patterns often reveal a shift in supply and demand before a breakout actually occurs.
The ascending triangle pattern clearly captures this dynamic by illustrating how market participants respond to repeated tests of support and resistance over a period of time.
- As the pattern develops, buyers begin stepping in at progressively higher levels. This behaviour suggests growing confidence among buyers, who are willing to accumulate positions at stronger price levels.
- Each pullback finds support sooner than the last, forming a rising floor of higher lows. The rising support line also reflects increasing conviction as market participants enter earlier during each cycle of consolidation.
- Meanwhile, the horizontal upper trendline marks an area where sellers consistently defend their positions. Each rally stalls at this resistance level, signalling a supply zone that, at first, holds firms.
- As the pattern matures, the price returns to resistance level more frequently and with less downward follow-through. This indicates that sellers’ ability to absorb demand is gradually weakening.
- As support rises and resistance holds, the range constricts to form a zone of compression. This tightening behaviour reflects shifting market sentiment, where buyers gain influence and sellers lose momentum. Traders pay close attention to this build-up because a decisive move often follows once one side asserts control.
- A break above resistance—especially if supported by increasing participation—suggests buyers have taken the upper hand. Conversely, a weak breakout or muted volume may indicate hesitation, increasing the potential for a failed move.
Ultimately, the ascending triangle visualises how market sentiment evolves during consolidation. It highlights the gradual transition of strength from sellers to buyers and provides context for interpreting potential continuation or reversal outcomes within the broader trend.
Is Using the Ascending Triangle Pattern Reliable?
The ascending triangle is widely recognised in technical analysis. But like any chart pattern, its effectiveness depends on prevailing market conditions, structure quality, and confirmation signals.
The table below summarises some of the commonly discussed strengths and limitations of the ascending triangle pattern: :
| Pros | Cons |
| Clear & easily recognisable structure | False breakouts can occur |
| Works across multiple timeframes and markets | Can be confused with similar patterns (see more below) |
| Provides defined areas for breakout and invalidation | Often requires volume confirmation |
| Supports both continuation & reversal scenarios | Breakout timing can be unpredictable |
Avoid Common Misidentifications of the Ascending Triangle Pattern
Did you know that several chart patterns can resemble the ascending triangle? Understanding their differences can help lower the likelihood of false interpretations:
- Ascending Broadening Triangle Pattern: Instead of converging, the trendlines widen, creating higher highs and higher lows with increasing volatility.
- Rising Wedge Pattern: Both trendlines slope upward, but the pattern often resolves bearishly as upward momentum weakens.
- Symmetrical Triangle: No flat resistance line, with both trendlines sloping inward at similar angles.
Key Distinction: The ascending triangle is often defined by horizontal resistance and rising support.
Ascending Triangle Pattern Trading Strategies to Explore
Before applying the ascending triangle to live markets, it’s important to understand the theoretical concepts of entry approaches, risk management, and evaluation of confirmation signals.
The following strategies provide a general framework for educational purposes only and should be adapted to individual risk tolerance and market conditions.
Two Methods of Entry
When studying ascending triangles, market participants often observe how price behaves around the resistance line, the rising support line, and the potential breakout area. In technical literature, two commonly referenced entry approaches include entering at breakout or subsequent retest.
1. Enter at Breakout
Traders may choose to enter when the price breaks above the resistance line and closes firmly outside the triangle. This signals that buyers have taken control and the pattern has confirmed its breakout.
- Entry: Place a buy order after a confirmed close above resistance.
- Stop Loss: Commonly placed below the rising support line or a recent swing low.
- Profit Target: Often estimated using the height of the triangle’s base projected upward from the breakout level.
2. Enter at Retest of Breakout Level
A more conservative entry method would be to wait for the breakout first, then enter during the retest.If the level holds as new support, it may offer a clearer indication of buyer strength.
- Entry: When price retests the old resistance level and shows signs of stabilising.
- Stop Loss: Typically placed beneath the retest support area.
- Profit Target: Use the triangle height projected upward from the breakout area.
Always keep in mind that these are general guidelines rather than guarantees, and readers should apply this information with careful consideration.
Calculating the Profit Target
As mentioned earlier, a commonly used technique to estimate the ascending triangle pattern target for profits is to measure the triangle’s height—the distance between resistance and the initial low—and project that value upward from the breakout point.
Example:
- Resistance: £100
- First Low: £95
- Height: £5
- Projected Target: £100 plus £5 equals £105
Managing Risk Using Other Technical Tools
Technical tools can help provide additional context around momentum and trend strength, but they should never be used as standalone signals. The effectiveness of the ascending triangle candlestick pattern becomes more pronounced when paired with broader market conditions, risk management techniques, and other forms of analysis.
1. Relative Strength Index (RSI)
Relative strength index (RSI) may help to confirm the strength of the breakout.
A rising RSI or readings above the midpoint may indicate bullish momentum. However, extremely high RSI can signal stretched conditions.
2. Moving Averages (MAs)
When the price trades above rising short- or medium-term moving averages (e.g., 20-day or 50-day MA), it can suggest that the market is trending upward1—a condition often associated with an ascending triangle pattern.
However, moving averages should be used as supporting context rather than definitive signals.
3. Moving Average Convergence Divergence (MACD)
A bullish moving average convergence divergence (MACD) crossover or expanding histogram bars that align with the breakout direction may indicate that momentum is supporting the price move.
As with any technical indicator, MACD should be used alongside other forms of analysis rather than as a standalone signal.
4. Bollinger Bands
If price moves towards or above the upper Bollinger Band during a breakout, it may indicate rising volatility and increasing market activity. This behaviour may support the broader structure of the ascending triangle but should be assessed together with other technical factors.
5. Volume Indicators
The ascending triangle volume is a key indicator for this chart pattern.
A noticeable increase in volume during a breakout may symbolise broader participation and stronger interest in the move. Conversely, limited volume may signal hesitation and raise caution about potential pattern failure.
As such, volume should be interpreted in context with price structure and other supporting tools.
Explore the Markets With the Ascending Triangle Pattern
The ascending triangle pattern offers a structured way to interpret how supply and demand evolve as markets approach a potential breakout zone.
By analysing the pattern’s defining features—horizontal resistance, rising support, narrowing consolidation, and volume changes—it provides key insights into how market participants may be positioning themselves.
It’s important to emphasise that the ascending triangle should not be used in isolation. Always remember that no single chart pattern is predictive on its own, and its effectiveness depends on broader factors such as trend conditions, volatility, liquidity, and confirmation from other technical tools.
Incorporating risk management and a multi-tool approach can help provide a more balanced assessment of whether a breakout shows follow-through or may be vulnerable to failure.
For those looking to explore this pattern further, a Vantage Demo Account offers a risk-free environment to practise recognising ascending triangles in real-time charts. When ready, traders can open a Vantage Live Account, equipped with advanced charting tools powered by TradingView to continue developing their technical analysis skills in live market conditions.
Frequently Asked Questions (FAQs)
What is the ascending triangle pattern?
The ascending triangle is a chart pattern formed by:
- A horizontal resistance line at the top
- A rising support trendline at the bottom
As price oscillates between these levels, the range tightens, suggesting growing pressure towards a potential breakout.
The ascending triangle pattern can appear in both uptrends and downtrends and may resolve as a continuation or reversal, depending on broader market context.
Is an ascending triangle bullish?
An ascending triangle is generally viewed as a bullish-leaning pattern because its structure reflects higher lows meeting a consistent resistance level. This shows rising buying interest over time.
However, the pattern does not guarantee an upward breakout. Market conditions, volatility, and volume all influence whether the structure resolves upwards, downwards, or fails to complete.
What is the best timeframe for trading the ascending triangle pattern?
There is no single ‘best’ timeframe for trading the ascending triangle pattern, as it can appear on intraday, daily, or weekly charts. That said, many traders find the pattern to appear clearer on higher timeframes, where price action tends to be smoother and less affected by short-term noise.
Regardless of timeframe, the ascending triangle candlestick pattern should be evaluated alongside other market factors rather than used as a standalone analysis tool.
What are common mistakes traders make with the ascending triangle pattern?
Some commonly discussed mistakes regarding the ascending triangle pattern include:
- Misidentifying the structure, such as confusing it with a rising wedge or symmetrical triangle
- Entering without confirmation, such as acting before price convincingly interacts with key levels
- Over-reliance on the pattern alone, without considering trend strength, volume or risk conditions
- Ignoring false breakouts, which can occur if momentum fails to support the move
These points highlight why the ascending triangle is best interpreted as part of a broader market analysis framework.
RISK WARNING: CFDs are complex financial instruments and carry a high risk of losing money rapidly due to leverage. You should ensure you fully understand the risks involved and carefully consider whether you can afford to take the high risk of losing your money before trading.
Disclaimer: The information is provided for educational purposes only and doesn’t take into account your personal objectives, financial circumstances, or needs. It does not constitute investment advice. We encourage you to seek independent advice if necessary. The information has not been prepared in accordance with legal requirements designed to promote the independence of investment research. No representation or warranty is given as to the accuracy or completeness of any information contained within. This material may contain historical or past performance figures and should not be relied on. Furthermore, estimates, forward-looking statements, and forecasts cannot be guaranteed. The information on this site and the products and services offered are not intended for distribution to any person in any country or jurisdiction where such distribution or use would be contrary to local law or regulation.
References
- “#6: Moving Average Trading Secrets – TradingWithRayner” https://www.tradingwithrayner.com/course/moving-average-trading-secrets/. Accessed on 3 December 2025.