Day trading with Contracts for Difference (CFDs) is a fast-paced strategy that involves speculating on short-term price movements across global financial markets. CFDs allow traders to speculate on intraday price movements across various markets, allowing them to buy and sell positions based on anticipated volatility without taking ownership of the underlying asset.
This trading style often leverages margin to amplify potential returns, but it also increases the risk of losses. As a result, it is generally more suited to individuals with a strong understanding of market behaviour and access to advanced trading tools.
At Vantage, traders can access comprehensive educational resources and market insights to support informed decision-making and skill development in CFD day trading.
Key Points
- CFD day trading involves short-term speculation on market movements without owning the underlying asset, making it suitable for active traders who can manage risk effectively.
- Strategies like momentum, and breakout trading help traders navigate intraday volatility and identify potential trade opportunities.
- Risk management techniques—such as controlling leverage, using stop-loss and take-profit orders, and staying informed on market news—are essential for disciplined day trading.
What is Day Trading?
Day trading is a short-term trading strategy in which financial positions are opened and closed within the same trading day, ensuring that no trades are held overnight. This approach seeks to take advantage of intraday price movements, relying on swift execution and continuous market monitoring.
Traders typically use technical analysis, chart patterns, and real-time data to identify entry and exit points, aiming to capture small but frequent potential returns throughout the day.
While day trading is often associated with traditional assets such as stocks, forex, and indices, it is also widely practised using derivative instruments like CFDs, offering flexibility to trade both rising and falling markets.
Regardless of the instrument used, the core objective of day trading remains consistent: to generate returns from short-term market fluctuations through a disciplined, well-informed, and risk-managed trading approach.
How to Start Day Trading?
To begin day trading CFDs, start by researching a broker that offers fast execution speeds, reliable charting tools, and access to the markets you wish to trade. You can open a live trading account or practise your strategy first on a demo account to familiarise yourself with the platform and test your approach.
Next, learn the fundamentals of technical analysis, risk management, and various day trading strategies such as scalping, momentum trading, and breakout trading. Equip yourself with tools like economic calendars, news feeds, and indicators such as RSI or moving averages. Most importantly, develop a disciplined trading plan and stick to it – consistency and risk control are crucial to long-term success.
Popular CFD trading strategies
Once you have created your trading account and gained a foundational understanding of day trading principles, the next step is to explore structured strategies supporting informed and methodical trading decisions.
Momentum trading strategy
In momentum trading, a trader seeks to take short-term positions in securities or markets that are trading higher, and then selling them off when there are signs the price is going down. After closing the position, the trader enters a new trade when a similar uptrend is spotted.
Note that momentum trading also works in a falling market. The trader goes short on a trade when a price downtrend is identified, and closes the trade when there are signs the price is coming back up.
A momentum trading strategy can be summed up as jumping from trend to trend, exiting each position before it turns against them.
The following examples are for illustrative purposes only and do not represent actual trading recommendations.
Example of momentum trading strategy in CFD trading
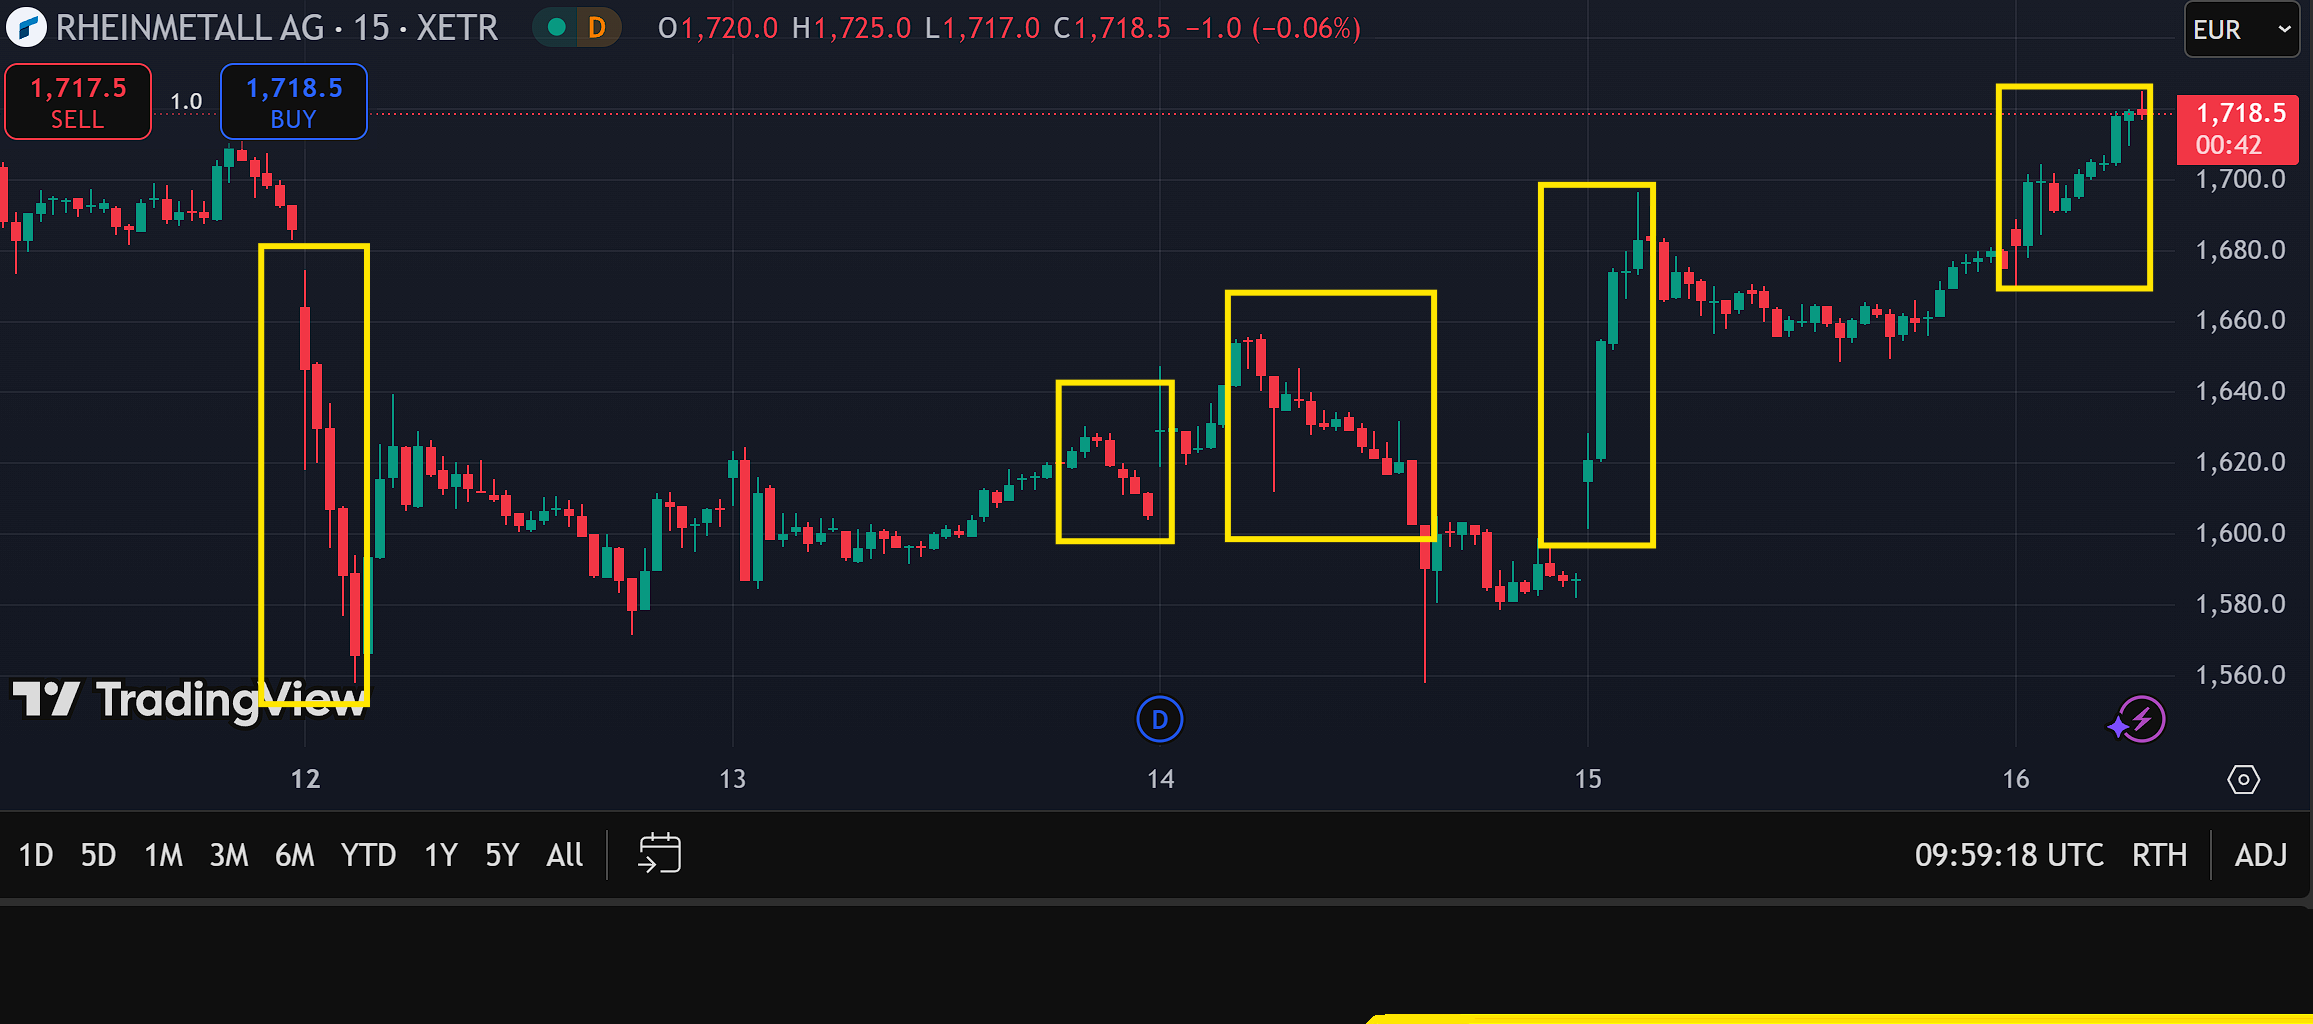
Shown above is the price chart of Rhinemetall AG (RHM), a holding company which offers development and sale of components, systems, and services for the security and civil industries.
As highlighted in the yellow boxes, the stock offers multiple opportunities for momentum trading, with clearly defined price trends. There were two such incidences denoted by long red/green candles, as well as three other less dramatic, but still definitive, price trends.
Since the goal of momentum trading is to trade along with the price trend, it is important to discern when a price trend is losing steam. A lessening in momentum often heralds an upcoming price reversal, signalling a potential trade exit point.
Some indicators that work well with a momentum trading strategy include relative strength index (RSI), the moving average convergence divergence (MACD), and Bollinger Bands.
Breakout trading strategy
While a momentum trading strategy seeks to ride the “ride the wave” when a price trend has been established, a breakout strategy looks for opportunities to trade just as a price breaks out of an ongoing trend.
The idea here is that once a price has successfully broken out, there is sufficient market momentum to continue pushing the price in the same direction. That’s to say, if the price breaks to the upside, it will likely continue trending upwards. If it breaks to the downside, the price will likely continue trending downward.
Thus, a breakout trader focuses on identifying price breakouts. Once spotted, they would open a trade in the relevant direction to potentially benefit from the resulting price trend.
The following examples are for illustrative purposes only and do not represent actual trading recommendations.
Example of a breakout trading strategy in CFD trading
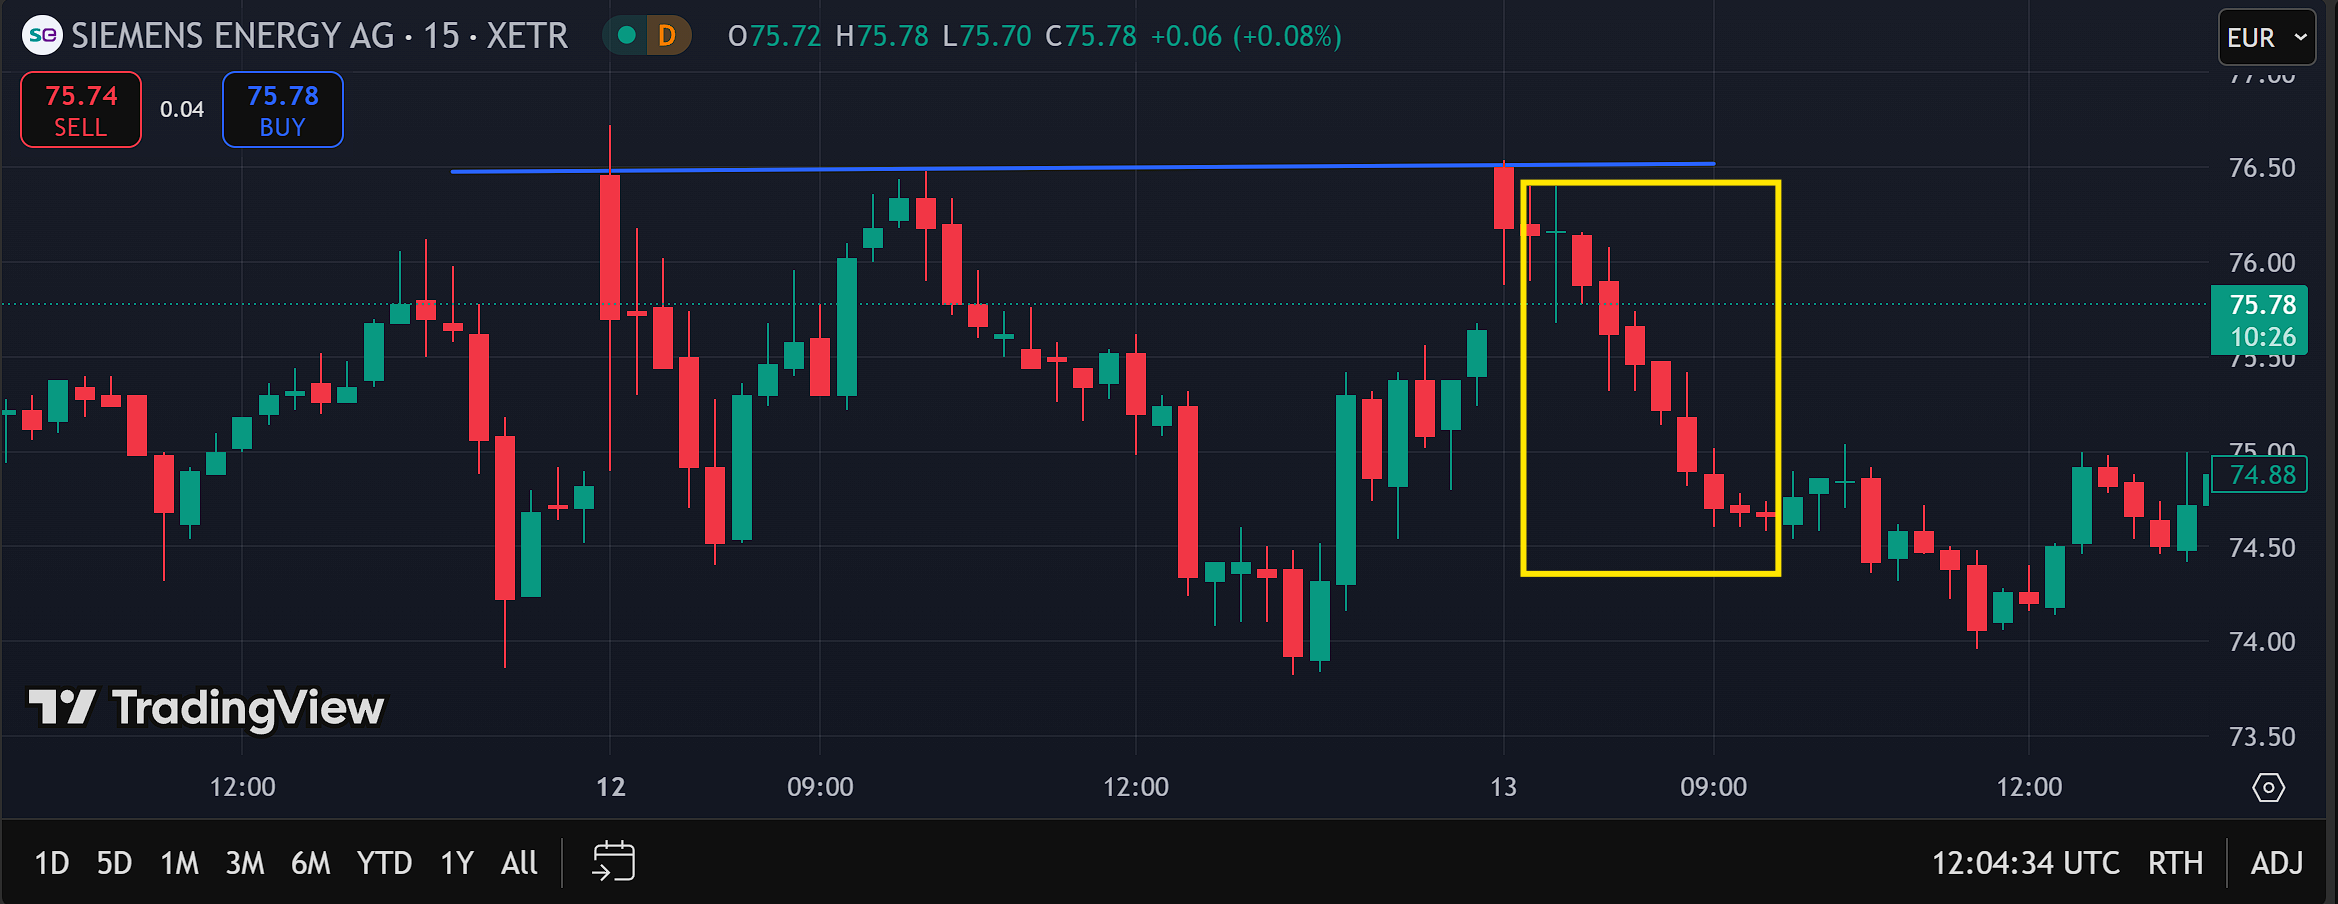
Shown above is the price chart of Siemens Energy AG (ENR), a provider of energy technology solutions. The chart has been set to 15-min trading intervals.
The blue line is a Line of Resistance, denoting a level at which the price failed to rise above. When a price bounces down from Resistance multiple times, this tends to signal a breakout to the downside. The more bounces formed, the greater the possibility of a breakout.
ENR’s price charted a breakout to the downside after being rejected at Resistance three times, with the resulting downtrend highlighted in the yellow box. A trader following the breakout trading strategy would note the three rejections as a potential entry point, taking a short trade to profit from the downtrend.
Key Considerations for CFD Day Trading
Pre-trading analysis and planning
If there is one thing in common among the three trading strategies discussed above, it is the study of the underlying market in order to spot potential trading opportunities.
Indeed, it is essential to be well-prepared before entering the market with a CFD day trade. This means honing an understanding of the underlying market you are trading, instead of going in purely because you spotted a recent price rally, or have been hearing about that particular stock on social media.
It is important to understand the factors that impact the market’s price action, and why the asset or market moved the way it did. This will help you plan your trades, which involves choosing an appropriate trading strategy, along with other essential factors such as position size, amount you’re willing to risk, and your target profit level for the trade.
Effective use of stop loss and take profit orders
Given that CFD day trading hinges on market volatility to reap profits, and trades are commonly made using leverage, having a proper risk management plan is paramount.
Two readily available risk management tools available to CFD traders are stop loss orders and take profit orders. These are automated orders that your broker will attempt to fill on your behalf when stipulated conditions are met.
Stop loss orders trigger when the price reaches your maximum risk level, closing your trade to prevent further losses.
Meanwhile, take profit orders trigger when your target profit level is reached. This closes your position automatically, securing your gains and helping avoid staying in a position too long and risking a trend reversal, turning a winning trade into a losing one.
Stop loss and take profits can be set when entering your trade. Traders should learn how to choose appropriate profit and loss levels to make optimal use of these risk management tools.
Risk management for intraday trading
Due to the extremely short timeframes in CFD day trading, traders should consider other facets of risk management beyond stop loss and take profit orders. Some of these include keeping track of market news and developments that could spark off volatility – ranging from scheduled announcements such as earning reports, to black swan events like the flash unwinding of the Yen carry trade.
To better support CFD day traders in managing risk, Vantage offers myriad tools and resources, including:
- Trading platforms such as MetaTrader 4 and MetaTrader5 with real-time market feeds
- Technical indicators and charting tools
- A range of trading accounts to suit traders with different experience levels
- An educational hub filled with courses, guides, e-books to hone your knowledge and skills
- Economic calendar to track important market events, along with market analysis and insights
- Round-the-clock customer service for assistance
Managing risk in CFD trading – Leverage, position size and market volatility
There are other important factors to consider when it comes to managing risk in CFD trading. These are leverage, position size and market volatility:
Leverage
Earlier, we explained that leverage can confer certain advantages, such as trading with a smaller initial deposit, or being able to control a greater number of positions simultaneously. The most compelling reason to use leverage is that it amplifies trading profits. But the same also applies to losses, as the outcome of your trade is calculated on the entire position, and not just the initial deposit.
This means that leverage can cause losses exceeding your trading balance, bringing your account into the negative (you will owe your broker money). Hence, it is imperative to control your use of leverage to avoid wiping out your account or worse, going into the red.
Position size and capital allocation
Along with controlling leverage, CFD traders should also pay attention to their position size. To work this out, first decide the maximum amount you’re willing to risk in the trade. Next, determine an appropriate stop loss point. Then you can work out how many shares you can trade, which gives you your position size.
Let’s illustrate with the following example:
- Maximum amount you’re willing to lose per trade: $500
- Stop loss point: $10
- Position size: 500/10 = 50 shares
A key factor in managing risk through position sizing is defining the maximum amount you’re willing to risk per trade.
As a general rule, this amount should be kept at 1% to 3% of your total trading budget; most professional traders choose a max risk of 2%. Alternatively, you can set a maximum dollar value per trade, regardless of your total trading budget.
Besides managing risk, setting your position size also facilitates proper allocation of your capital; you want to spread your trading capital efficiently across a reasonable number of trades.
For instance, setting a 1% position size gives you at least 100 trades, while a position size of 2% gives you only 50 trades. Choose a balance between amount risked per trade and overall number of trades.
Market volatility
Lastly, market volatility must also be taken into account. Volatility refers to the degree to which price changes over time. The higher the volatility, the larger the price change – both up and down.
While CFD day traders rely on short-term volatility to execute their strategies, too much volatility can bring disadvantages, including:
- Greater potential for the market to go against your position
- Wider spreads, which increase your trading cost
- Increased margin calls, which require more funds to be deposited to maintain your position
- Increased slippage, which causes the execution price of a trade to diverge from the expected price, leading to distorted trading outcomes
Stop loss and take profit orders can help to offset some of these disadvantages, but can still be thwarted by higher slippage and increased spreads, for instance. Thus, it is important to pick markets or assets with a manageable degree of volatility. Refraining from trading when volatility becomes too high is also a credible way to manage volatility risk.
Common pitfalls to avoid in CFD day trading
Overtrading and emotional trading
One of the most common pitfalls facing new or inexperienced traders is the lack of emotional control and discipline. Day trading CFDs is a high-stakes, fast-paced activity, and can quickly overwhelm those unprepared.
This can quickly lead to overtrading. For instance, when facing a losing position, fear can cause a trader to stubbornly hold on to their trade, believing the market will soon turn around, only to be proven wrong and face deeper losses.
Conversely, instead of closing a winning trade to secure gains, a trader may give in to greed and keep their position open in the hope of reaping a bigger gain. However, the market moves against their position, turning a winning position into a losing one.
Emotional trading – or making trading decisions while driven by fear, greed or other negative emotions – can backfire, reducing profits or inflicting losses. A trader affected by emotional trading may also be tempted to keep their positions open overnight in hopes of a relief rally the next day, but this can expose the trader to additional risks not typically aligned with intraday strategies.
In day trading, positions should not be kept open overnight. This is to avoid holding fees and eliminate price gapping, where the market opens in a vastly different position than the previous trading day. When a price gap happens, this will blow past stop losses, inflicting losses deeper than expected – once more leading to worse trading outcomes.
How to avoid
The solution to overtrading and emotional trading is discipline. Traders should approach trading in a well-structured manner with a clear plan in mind. Decide beforehand the parameters of each trade, and close your position as planned.
It is also helpful to note down your experiences and trading results in a trading journal, which you should review periodically as you hone your trading skills.
Ignoring market news and events
CFDs allow day traders to trade the price action of an underlying asset or market, and these are inevitably impacted by macroeconomic news and geopolitical events. For instance, stock prices are invariably affected by corporate earnings, and it is common for volatility to be heightened when earnings reports are due to be announced.
Another example are commodities, the prices of which are driven by supply and demand levels. Events such as central banks buying up gold can drive price rallies in gold CFDs.
By ignoring market news, a day trader risks being caught unawares, being unprepared for market volatility, which could lead to missed observations or increased risk exposure.
How to avoid
Educate yourself on what could potentially impact the markets underlying your CFD trades, and start keeping track of relevant news and announcements. Set news alerts based on keywords or topics, subscribe to trade journals, and follow market analysts for the latest insights.
You can also make use of Vantage’s economic calendar to stay informed of important market news, such as earnings reports, economic data releases and more.
Mismanagement of risk and leverage
As we’ve discussed earlier in the article, risk management and controlled use of leverage is essential when day trading CFDs.
Do not assume that risk management is only for advanced or serious traders with high capital at risk. In fact, risk management should be implemented in every trade, no matter how large or small.
How to avoid
Always ensure that you choose the right position size when trading. When using leverage, bear in mind that your trading outcome – profit or loss – is calculated on your total position size, and not just the initial deposit.
Make proper use of stop loss and take profit orders, and once set, avoid altering or removing them mid-trade without clear rationale.
Advanced techniques for intraday trading
Technical indicators popular among CFD day traders
As day trading CFDs require quick decision-making, traders rely on technical indicators to help them interpret price charts and spot upcoming trade entry and exit points. Learning how to skillfully deploy these popular technical indicators can help improve your CFD trading outcomes.
The following examples are for illustrative purposes only and do not represent actual trading recommendations.
Moving averages
A Moving Average (MA) creates a constantly updated average of an asset’s price over a stipulated time frame. It is “moving” because the price is always updated with each new trading period.
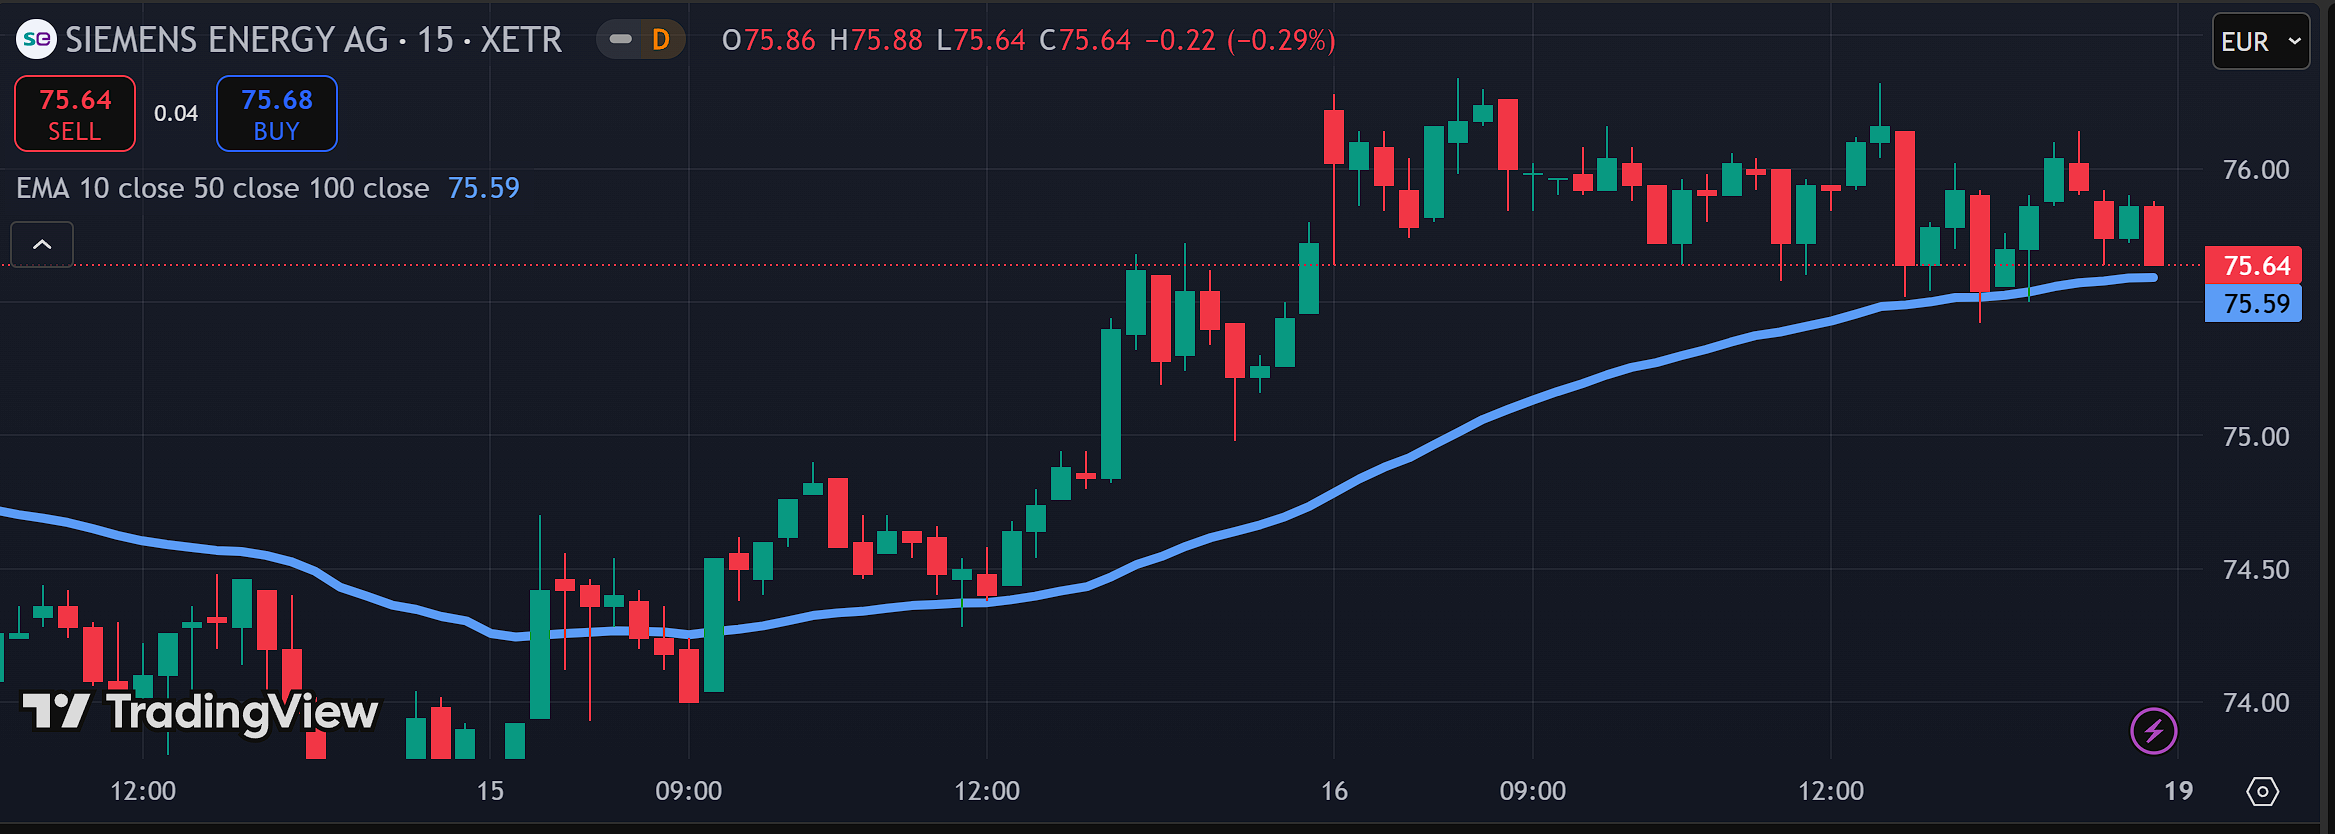
The screenshot above shows the 15-min chart Siemens Energy AG. The choppiness of the candlesticks make it difficult to discern which way the price is going, especially towards the right-half of the chart.
The light blue line is an Exponential Moving Average (EMA) plotted with the prices in the most recent 50 trading timeframes. EMA is a variant of an MA that gives more emphasis to the latest prices, allowing it to be a more agile indicator of upcoming price changes.
With the EMA added, we obtain a clearer and smoother trendline, indicating that the stock remains in an uptrend. However, the flattening gradient towards the end of the EMA signals that the price uptrend is weakening.
Besides helping a day trader to smooth out price action and better discern price trends, MAs can also act as dynamic Support and Resistance levels. For instance, a market that is rising above a steadily gaining EMA plotted with 20 trading intervals may suggest upward momentum, which some traders interpret as a long signal.
Relative Strength Index (RSI)
Relative Strength Index (RSI) is a technical indicator used to measure the speed and magnitude of recent price changes, detecting overbought or oversold conditions in the price of the security. These conditions can point to potential trading entry and exit points.
RSI is displayed as an oscillator ranging from 1 to 100. Conventionally, readings of 30 and below indicate oversold conditions (meaning prices are low) which may suggest conditions that traders interpret as long signals. Readings of 70 and above indicate the market is overbought (meaning prices are high) which may suggest conditions that traders interpret as short signals.
The following examples are for illustrative purposes only and do not represent actual trading recommendations.
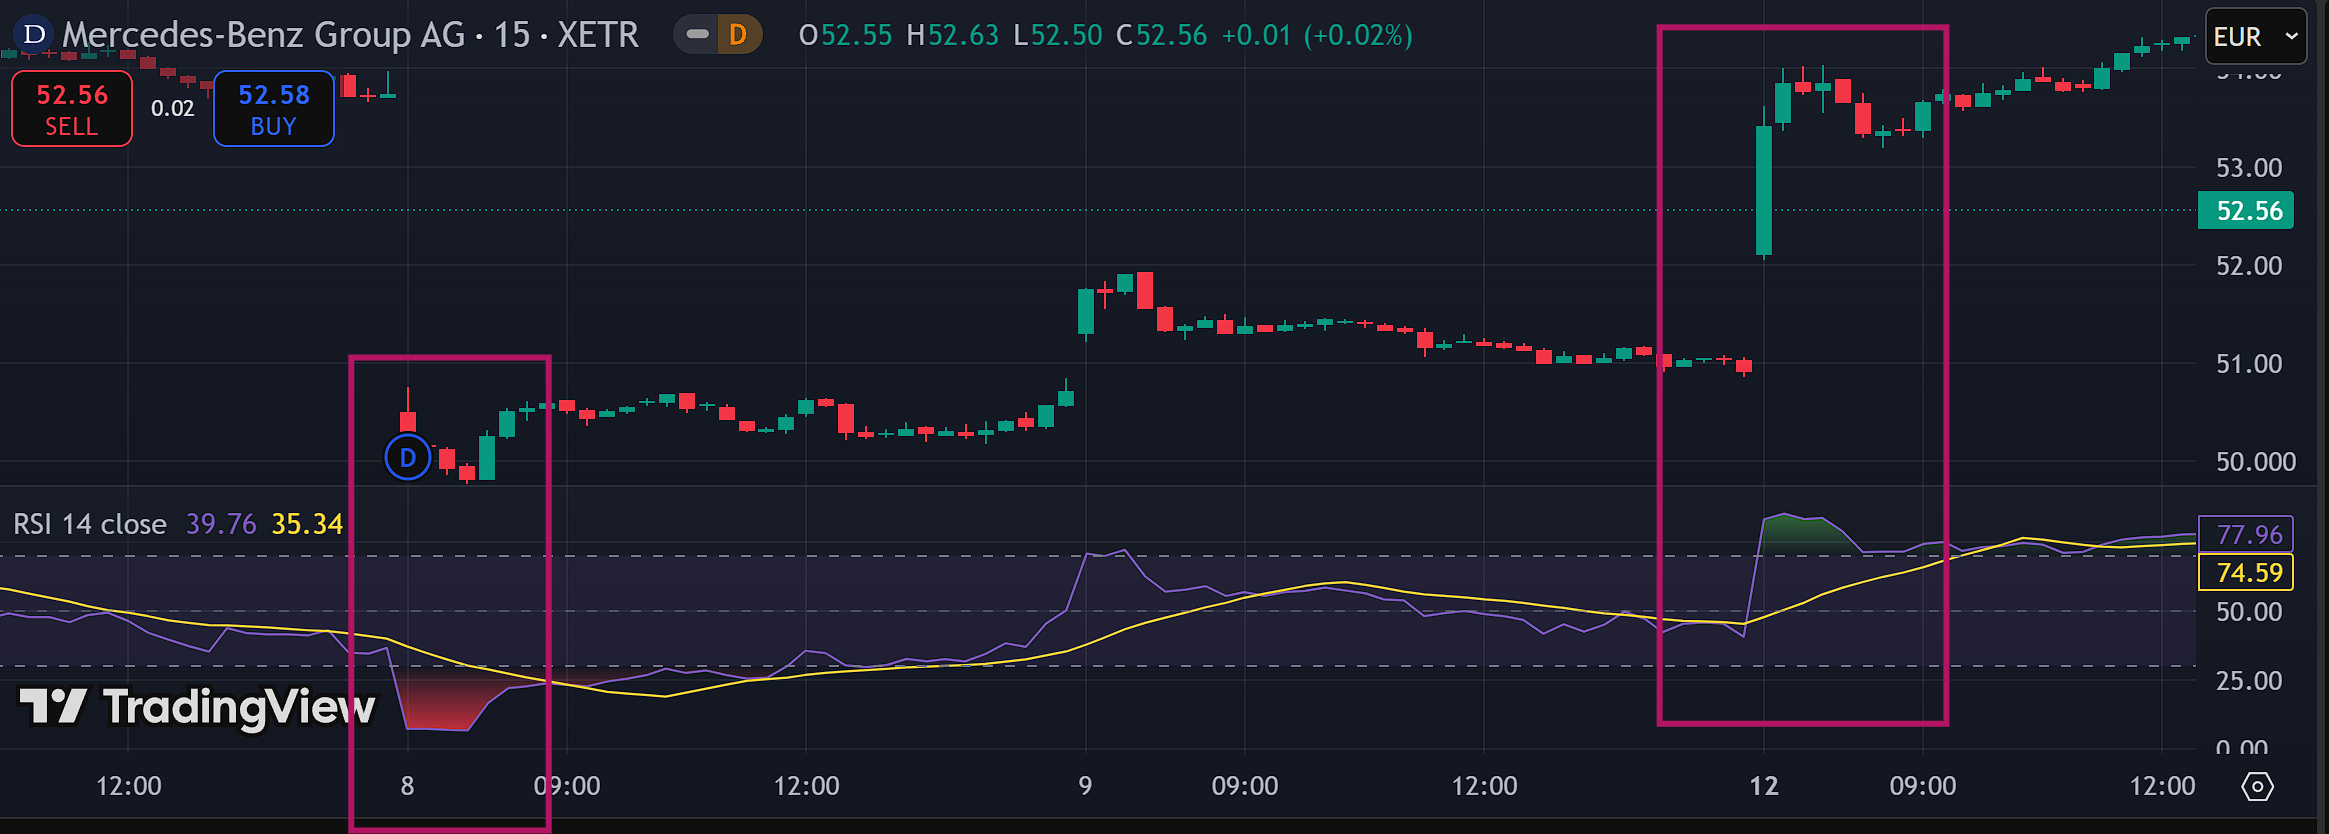
Shown above is the 15-min price chart of German luxury car maker Mercedes Benz Group AG. The RSI is displayed below the price chart; note both areas highlighted by the boxes in pink.
On the left, we see a bright pinkish area in the RSI, this highlights an “oversold” reading, corresponding with a decline in the price of the stock. (The reason for the sell-off was the decline in dividend payout, down to EUR 4.30 vs EUR 5.30 in 2023.) [1]
The stock continued to trade mostly sideways for the next four days, until market sentiment recovered, with the stock price gapping upwards overnight, as seen in the large green candle. This price rally quickly pushed the RSI into an “overbought” reading, shown as a green-tinted area.
Volume-Weighted Average Price (VWAP)
Volume-Weighted Average Price (VWAP) calculates a security’s average price for the trading interval, weighted by trading volume. It can be used to analyse price trends and liquidity – the latter of which is important in fast-paced CFD day trading.
VWAP is highly useful to short-term traders, acting as a readily available price benchmark. It can also be used to confirm price trends.
When prices are below VWAP, the market may be considered undervalued; when the price moves above VWAP, this indicates a potential opportunity to open a long trade.
Conversely, when prices are above VWAP, the market may be considered overvalued. When the price moves below VWAP, this indicates a downtrend, which traders may interpret as a potential signal for short positioning.
The following examples are for illustrative purposes only and do not represent actual trading recommendations.
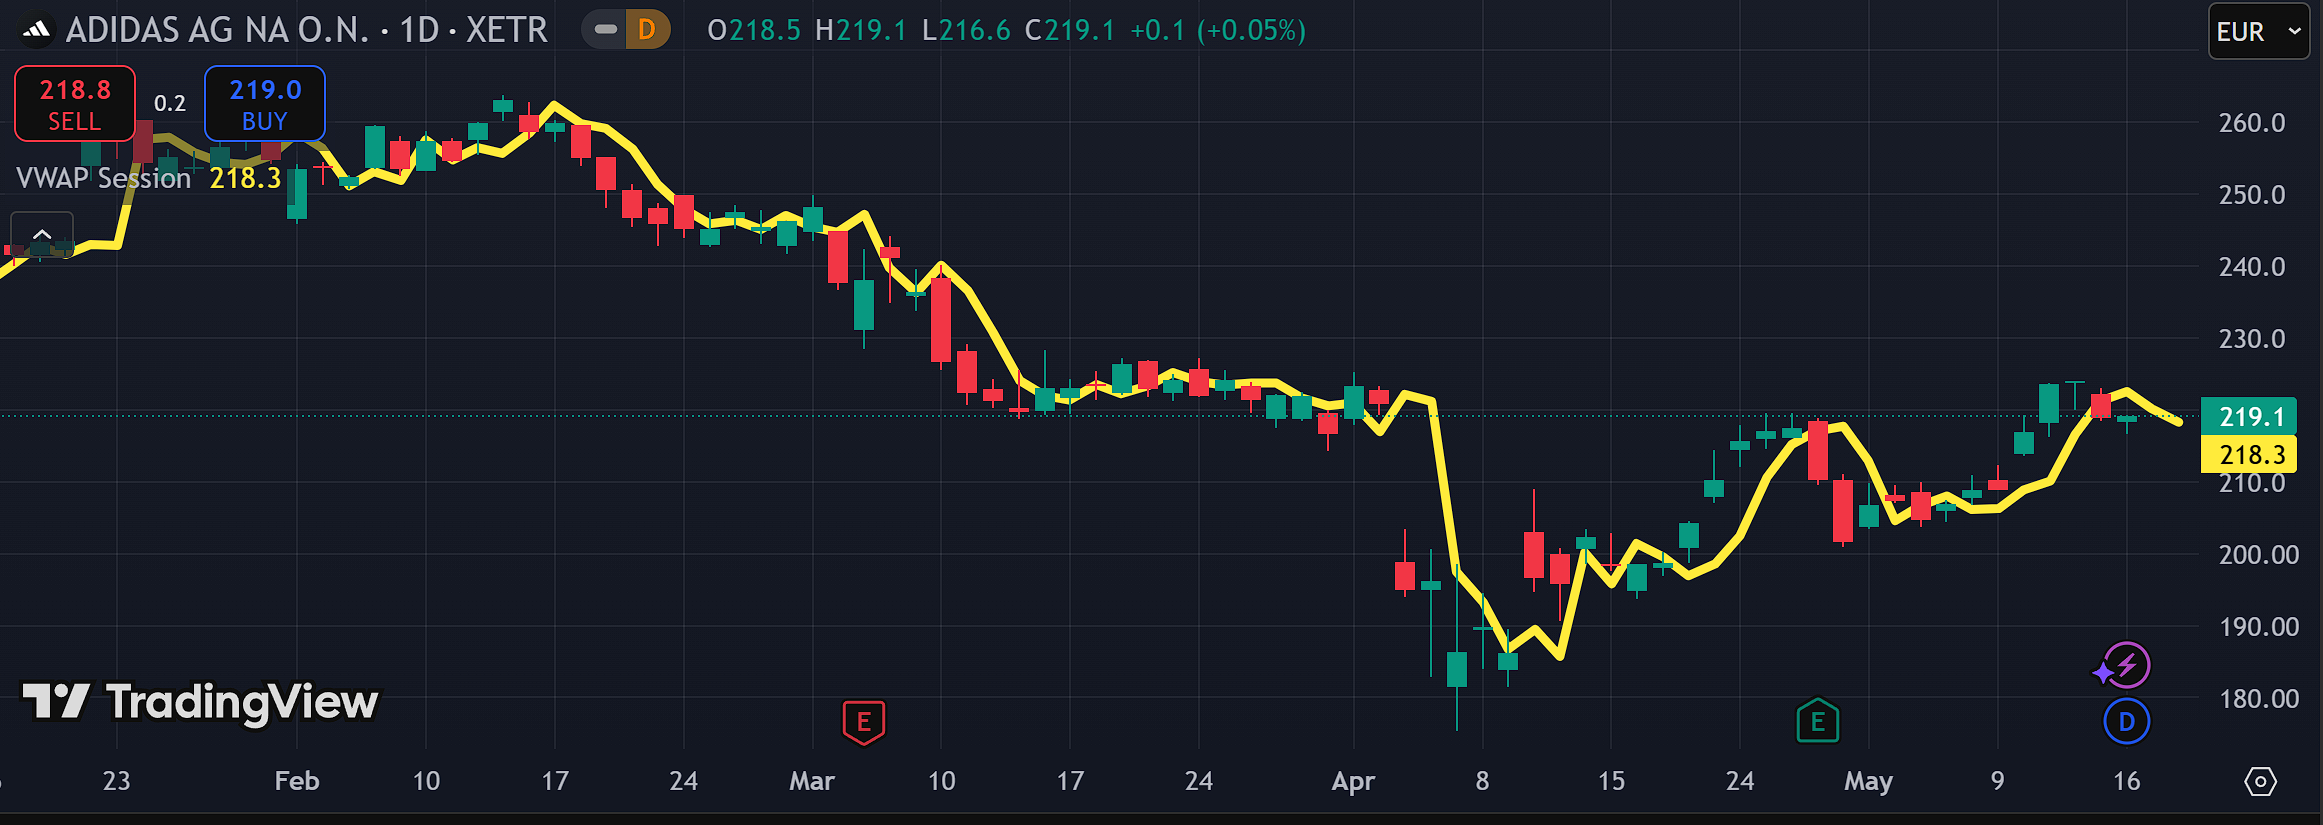
Shown above is the price chart of lifestyle retailer Adidas AG, at 15-min trading intervals. The VWAP has been added, seen here as the yellow line.
As explained above, when Adidas is in a downtrend, the candlesticks come under the VWAP. When an uptrend is present, the candlesticks float above the VWAP.
Conclusion
In this article, we’ve discussed various important aspects of day trading with CFDs. You now understand basic trading strategies, advanced technical indicators, practical tips to improve your outcomes and common pitfalls to avoid, hopefully giving you much more information about what day trading CFDs is all about.
Vantage provides access to advanced trading platforms, real-time market data and a range of educational resources for CFD traders. Our platform includes features such as competitive spreads, low commissions, and a transparent pricing model.
Because trading is a lifelong skill, continue to hone your knowledge and keep up with market developments with our extensive library of educational resources, learning tools and latest insights. Ready to explore our trading platform? Learn more today.
References
- “Mercedes-Benz Q4 Profit Declines, Cuts Dividend; Plans Up To EUR 5 Bln Share Buyback – Nasdaq” https://www.nasdaq.com/articles/mercedes-benz-q4-profit-declines-cuts-dividend-plans-eur-5-bln-share-buyback Accessed 17 May 2025